Uniconnect Edge
Uniconnect Edge Analytics
Edge Analytics is designed to deliver real-time, actionable insights directly within the Uniconnect Edge agent desktop. Its primary purpose is to bridge the gap between operational data and agent actions by making key metrics instantly visible during live customer interactions.
By embedding analytics into the agent workflow, Edge Analytics ensures that agents can monitor critical operational indicators without relying on separate reports or external dashboards. This enables faster responses, better prioritization, and more informed decision-making at the point of engagement.
Accessing Edge Analytics
The Edge Dashboard module can be accessed from the Uniconnect configuration area. Access to this module is managed through Role Management*(link to Role Management)*, ensuring that only authorized users can configure Edge Analytics.
- From the left‑hand navigation menu, click Configuration.
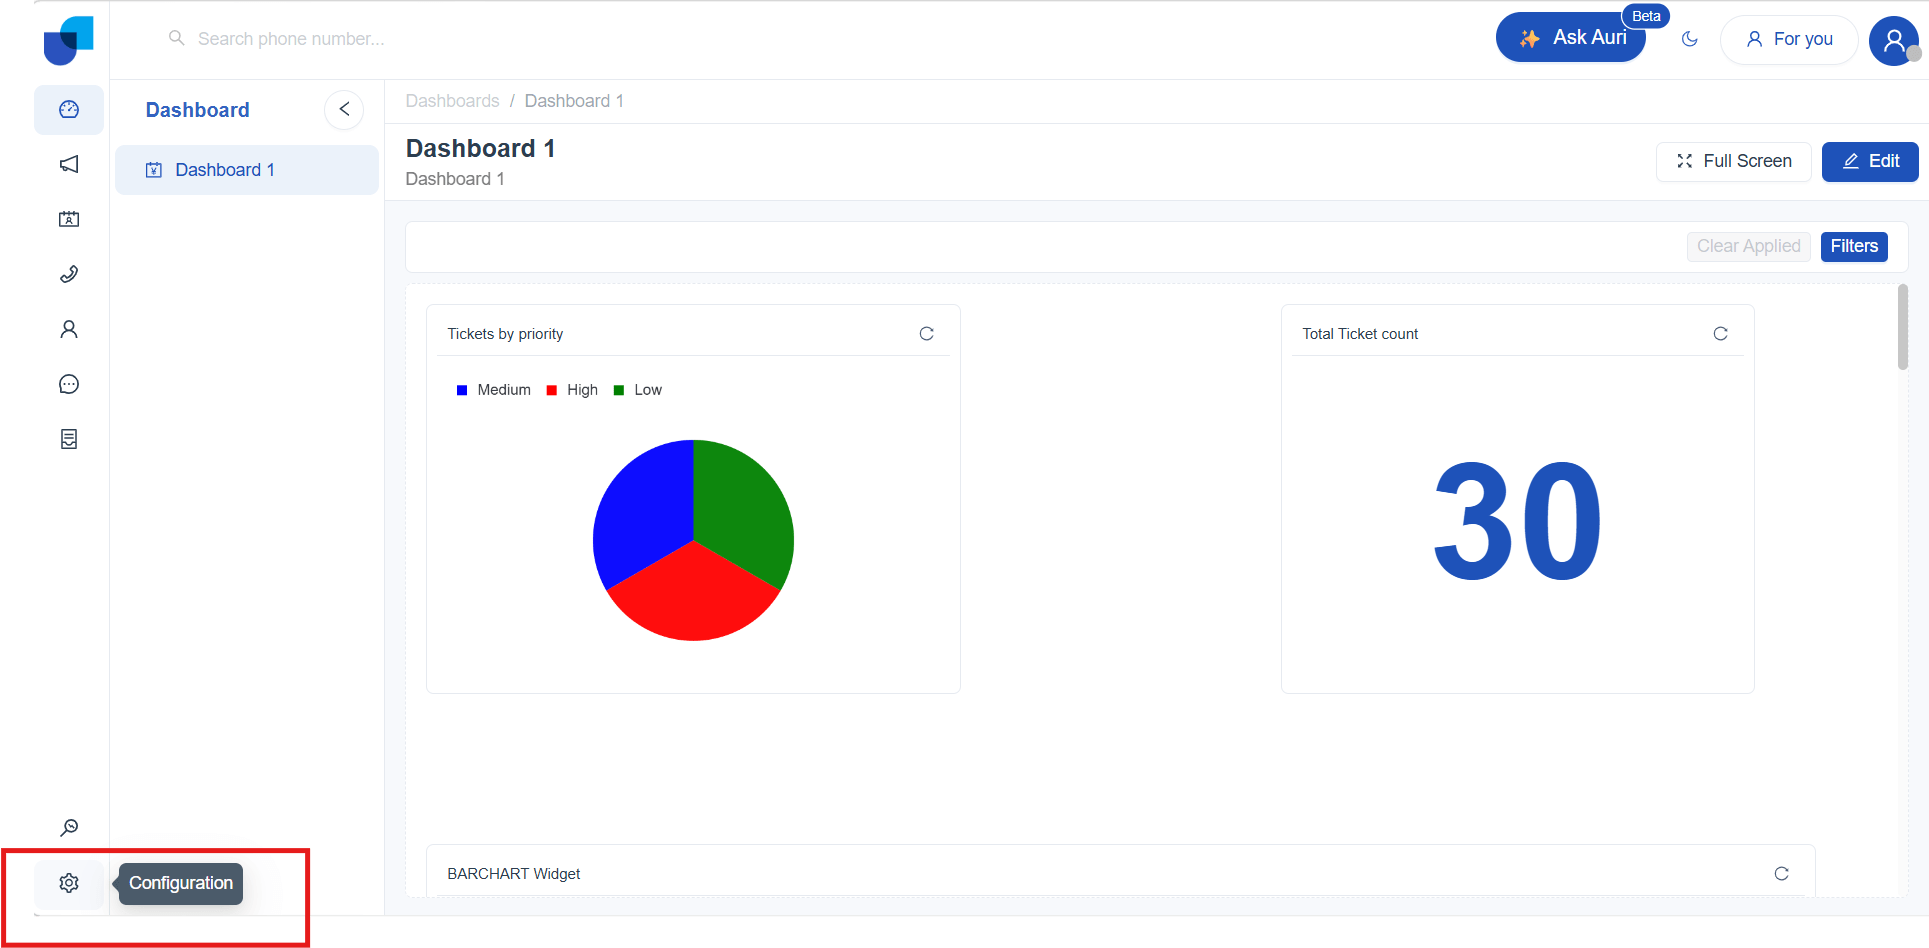
- Under Configuration, select Edge Dashboard.
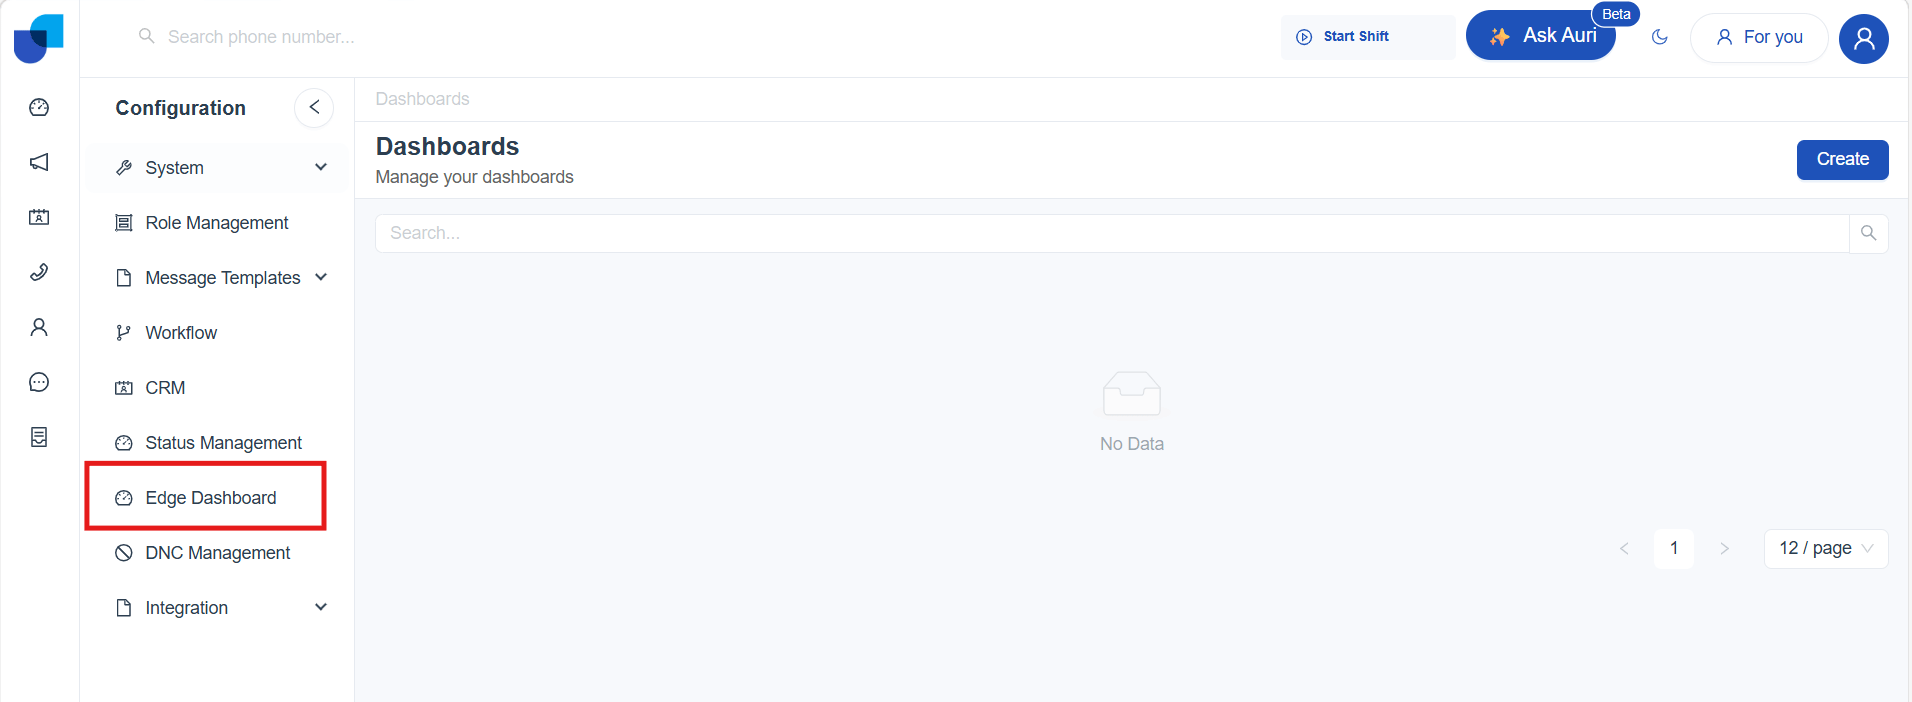
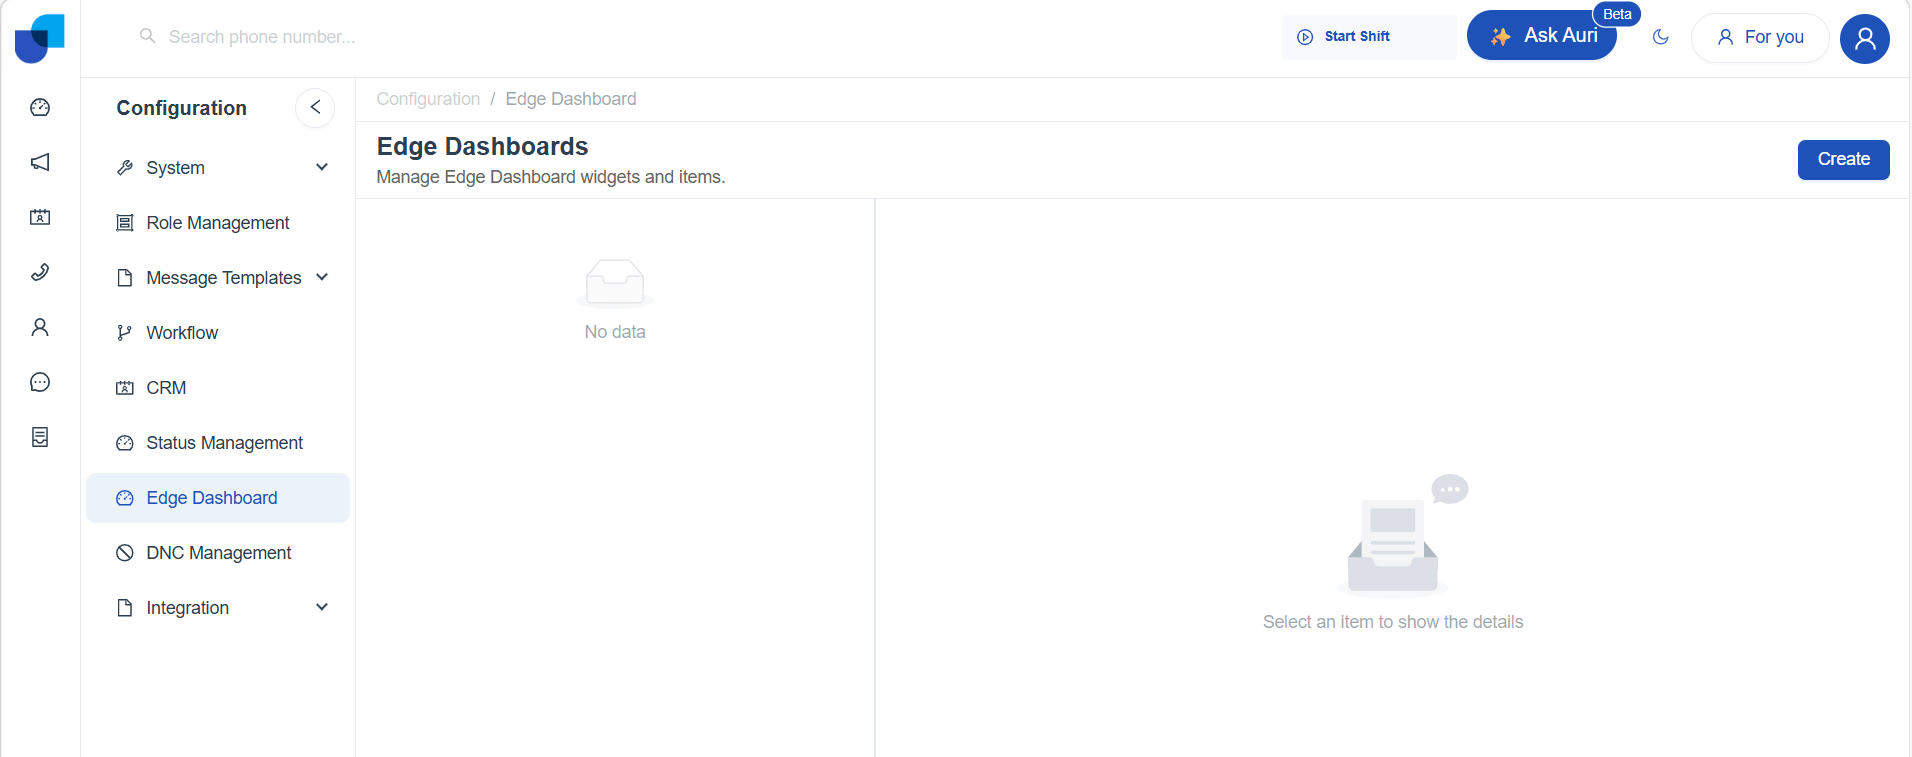
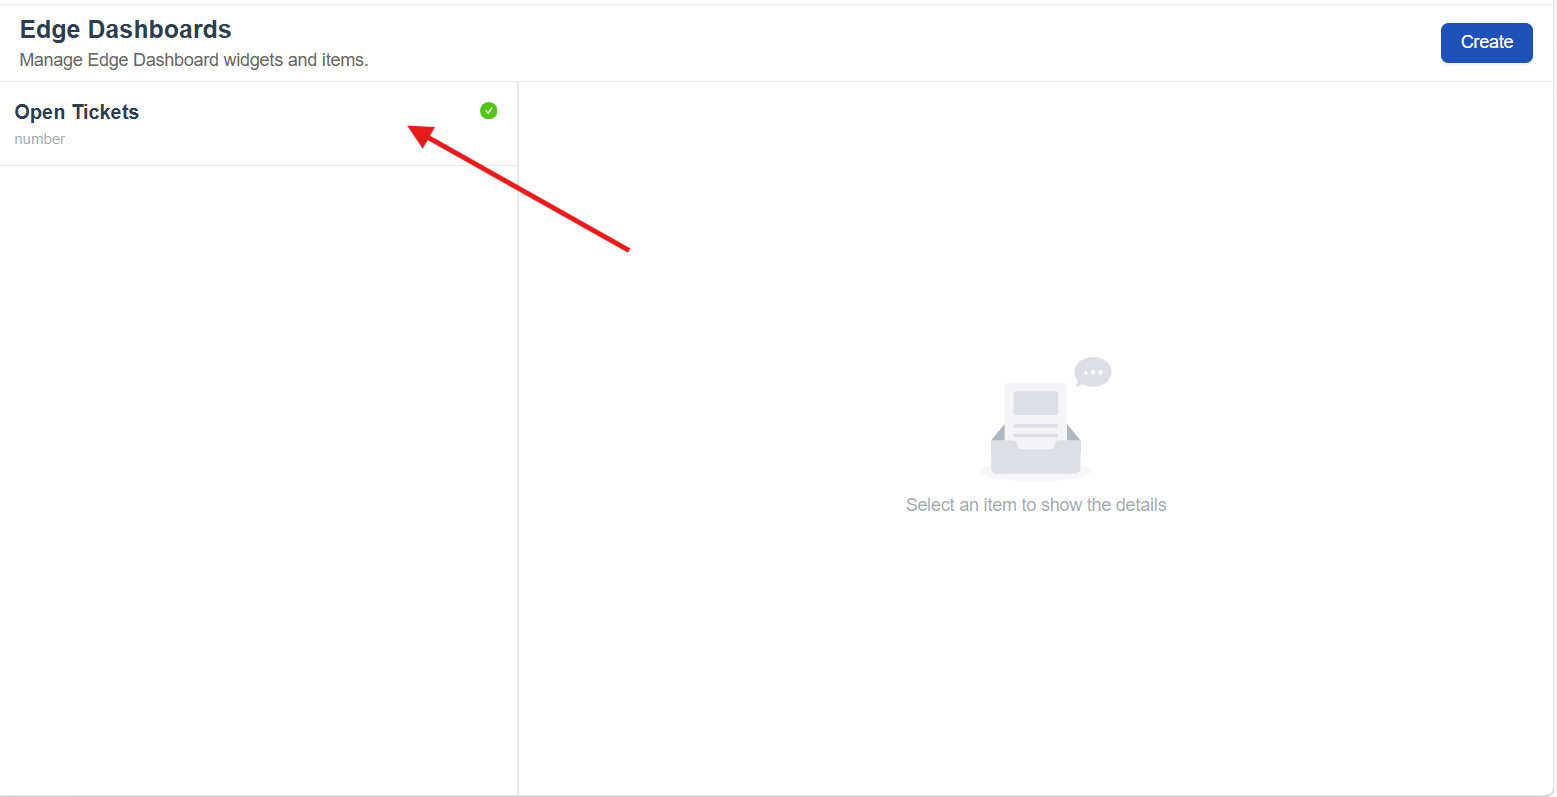
- The Edge Dashboards screen opens, displaying a section that displays created dashboard widgets, along with a Create option that allows authorized users to add new Edge Dashboard widgets.
Widget Configuration
The Widget Configuration Interface is displayed within the Edge Dashboard module when an authorized user creates a new dashboard widget or selects an existing one for configuration. This interface allows users to define how a dashboard widget is structured and what data it displays in Uniconnect Edge.
The screen is divided into clearly defined sections to support simple and guided configuration.
- Meta Data Palette
- Configuration Area
Metadata Palette
The Metadata Palette is displayed on the right side of the screen and contains the data sources available for widget configuration.
Learn More : (link to: Reports meta palette)
Configuration Area
The Widget Configuration Area is used to define how an Edge Dashboard widget is structured and what data it displays in the Uniconnect Edge application. This area appears when an authorized user creates a new widget or edits an existing one.
By clicking the Create, a new widget configuration interface is opened, allowing users to define the widget details.
The configuration area consists of the following fields.
1. Name
The Name field is used to specify the title of the dashboard widget.
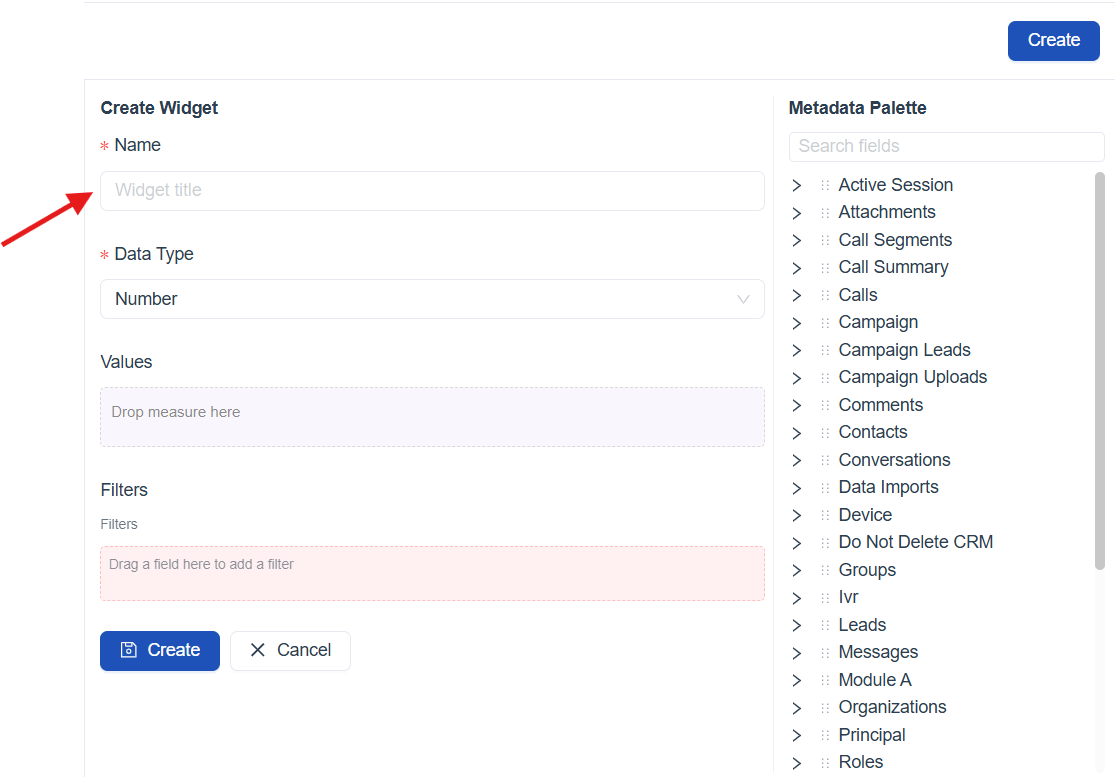
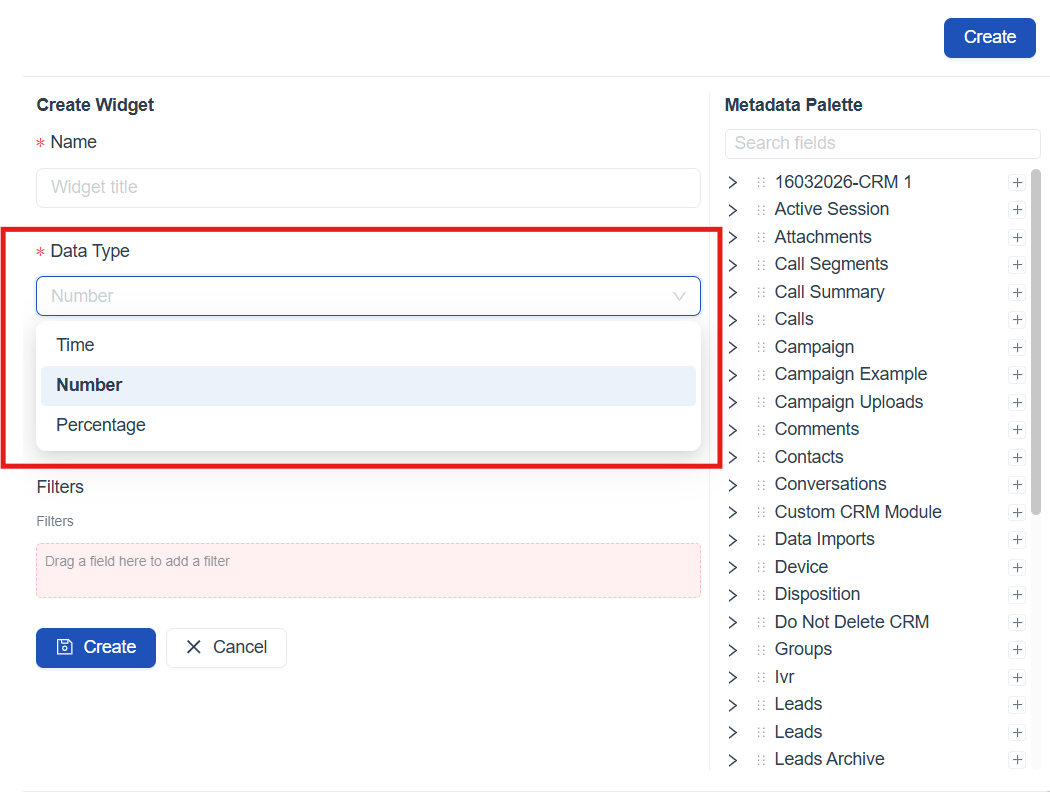
2. Data Type
The Data Type field defines how the widget value is calculated and displayed.
By default, the Data Type is set to Number when creating a new widget.
The available data types are:
-
Number – Displays the value as a numerical count
-
Time – Displays the value as a time duration
-
Percentage – Displays the value as a percentage
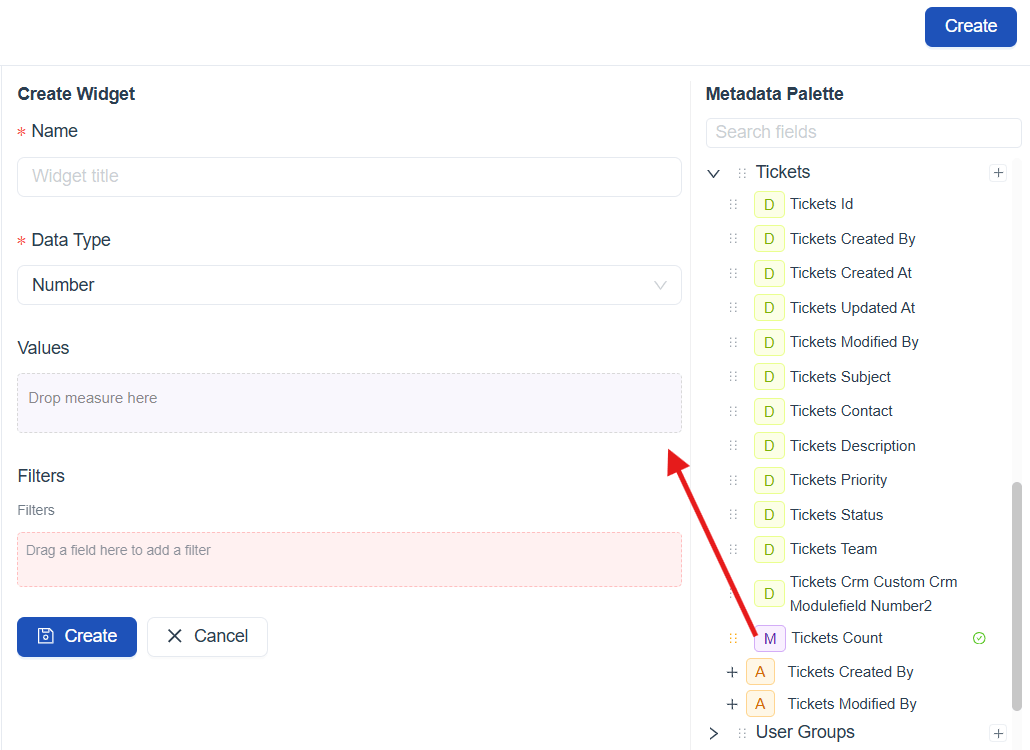
3. Values
The Values section defines the primary metric that the Edge Dashboard widget displays in the Uniconnect Edge application.
Metrics are dragged from the Metadata Palette into the Values area.
[!IMPORTANT] Only metadata fields that are specifically supported as values can be used in this section.
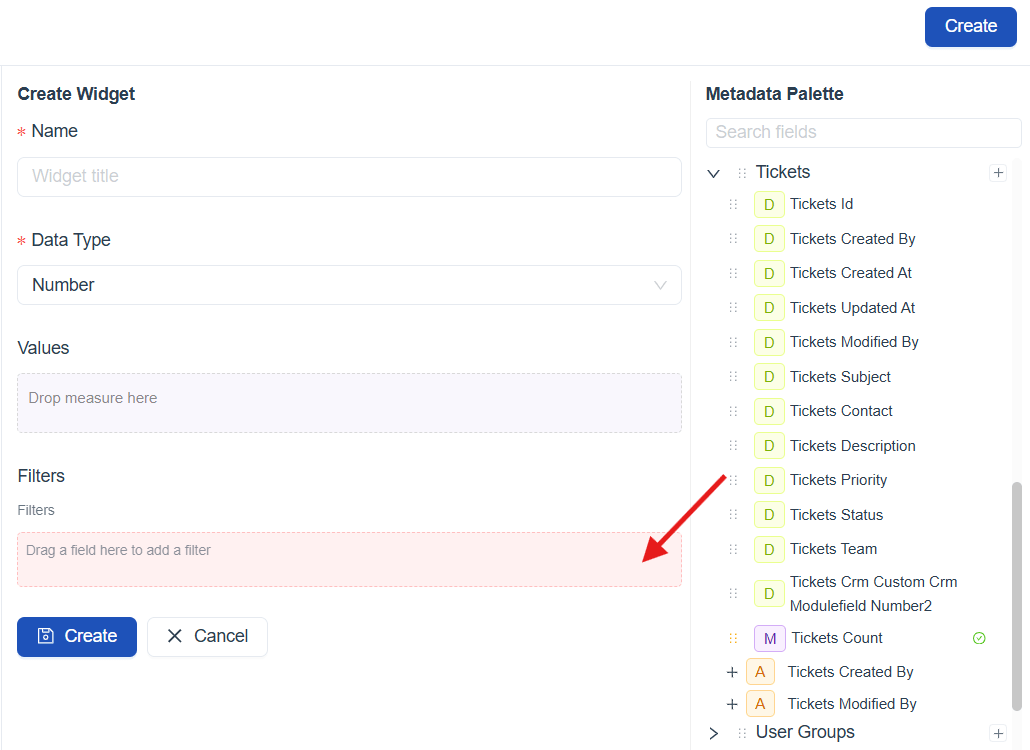
4. Filters
The Filters section is used to narrow down the data included in an Edge Dashboard widget by applying specific conditions.
Filters are added by dragging fields from the Metadata Palette into the Filters area.
[!IMPORTANT] Unlike the Values section, filters can use both metrics and dimensions. This allows users to refine widget data using descriptive attributes as well as measurable fields, enabling more precise and relevant analytics.
Filter Types
The available filter options vary based on the data type of the selected dimension or value.
Edge Dashboard supports four main filter categories, Text, Numeric, Enum, and Date.
| Filter Category | Filter Type | Explanation |
|---|---|---|
| Text Filter | Is set | Filters records where the selected field contains any value. |
| Is not set | Filters records where the selected field is empty | |
| Equals | Filters records where the field value exactly matches the specified text. | |
| Not Equals | Filters records where the field value does not exactly match the specified text. | |
| Contains | Filters records where the field value includes the specified text. | |
| Not Contains | Filters records where the field value does not include the specified text. | |
| Starts With | Filters records where the field value begins with the specified text. | |
| Not Starts With | Filters records where the field value does not begin with the specified text. | |
| Ends With | Filters records where the field value ends with the specified text. | |
| Not Ends With | Filters records where the field value does not end with the specified text. | |
| Numeric Filter | Is set | Filters records where the selected numeric field contains any value. |
| Is not set | Filters records where the selected numeric field is empty or not populated. | |
| Equals | Filters records where the numeric field value exactly matches the specified number. | |
| Not Equals | Filters records where the numeric field value does not match the specified number. | |
| Greater Than | Filters records where the numeric field value is greater than the specified number. | |
| Less Than | Filters records where the numeric field value is less than the specified number. | |
| Greater Than Equal | Filters records where the numeric field value is greater than or equal to the specified number. | |
| Less Than Equal | Filters records where the numeric field value is less than or equal to the specified number. | |
| Between | Filters records where the numeric field value falls within the specified range. | |
| Enum Filter | Is set | Filters records where the selected Enum field contains any value. |
| Is not set | Filters records where the selected Enum field is empty or not populated. | |
| Equals | Filters records where the Enum field value matches one or more selected values. | |
| Not Equals | Filters records where the Enum field value does not match one or more selected values. | |
| Date Filter | Today | Filters records with dates matching the current date. |
| Yesterday | Filters records with dates matching the previous date. | |
| This Week | Filters records with dates within the current calendar week. | |
| This Month | Filters records with dates within the current calendar month. | |
| This Year | Filters records with dates within the current calendar year. | |
| Last Week | Filters records with dates within the previous calendar week.(Mon - Sun) | |
| Last Month | Filters records with dates within the previous calendar month. | |
| Last Year | Filters records with dates within the previous calendar year. | |
| Last 7 Days | Filters records with dates from the last 7 days, including the current date. | |
| Last 30 Days | Filters records with dates from the last 30 days, including the current date. | |
| Last 12 Months | Filters records with dates from the last 12 months, including the current date. | |
| Custom | Filters records based on a user-defined start and end date and time. |
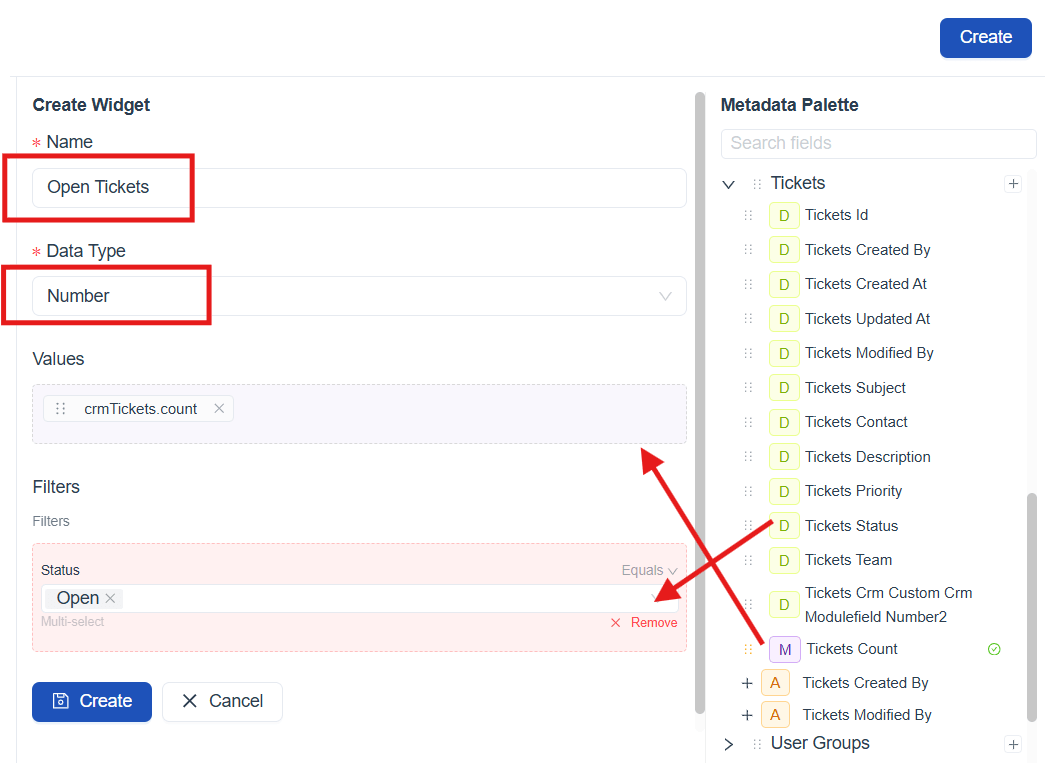
Better Understand with a User Scenario
The objective is to understand how many tickets are currently open so that agents can quickly assess the overall workload. Since this requirement involves displaying a count, the Data Type is set to Number. By selecting Ticket Count as the value and applying a filter for Ticket Status = Open, the widget displays a single numeric value representing the total number of currently open tickets in real time.
Once the widget configuration is completed, click Create. The newly created widget is saved and appears in the Edge Dashboard widget list, where it can be viewed and managed. The widget is then automatically synchronized and made available in the Uniconnect Edge application.
How Dashboard Widgets Appear in Uniconnect Edge
Once dashboard widgets are created in the Uniconnect Platform, they become available in the Uniconnect Edge application. When an agent logs in to Uniconnect Edge, the configured dashboard widgets are automatically loaded and displayed within the agent desktop.
As per the above scenario, the dashboard widget created to display current open tickets appears in the Uniconnect Edge application as a numeric tile labeled Open Tickets.
Floating Mode:

Doc Mode:
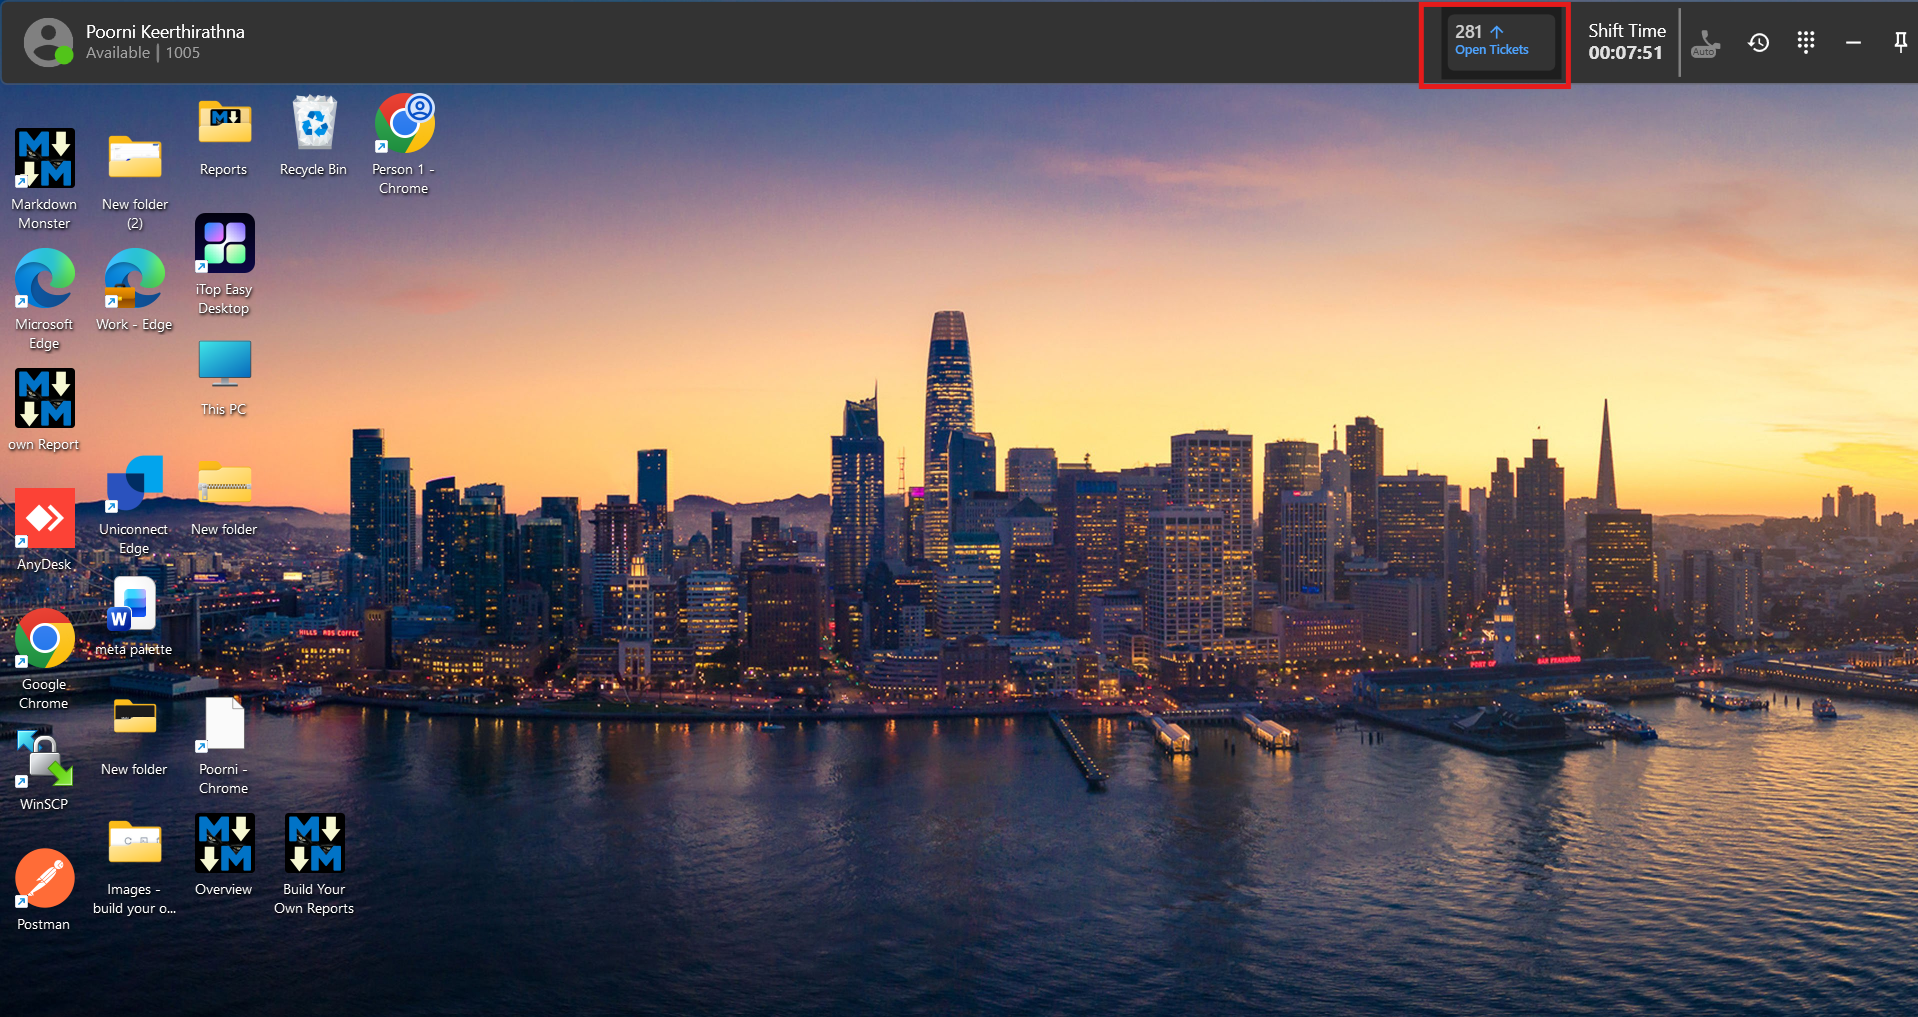
[!IMPORTANT] While an agent is logged in to the Uniconnect Edge application, dashboard widgets update in real time, and each update compares the latest value with the previously displayed count, showing an upward arrow (↑) when the value increases and a downward arrow (↓) when it decreases during the active session.

Edge Dashboard Limitations
- Newly created dashboard widgets may not appear immediately in the Uniconnect Edge application. In such cases, agents need to log out and log back in to the Edge application for the new widgets to be displayed.