Build-Your-Own Dashboards
Uniconnect Dashboard
UniConnect Dashboards provide a centralized view of critical business insights, allowing users to monitor key metrics, trends, and performance at a glance. By organizing multiple visualizations into a single, interactive view, dashboards help teams quickly understand data and make informed decisions without navigating through multiple screens.
How to Create a New Dashboard on UniConnect
From the UniConnect left‑side navigation panel, click the Dashboard icon.
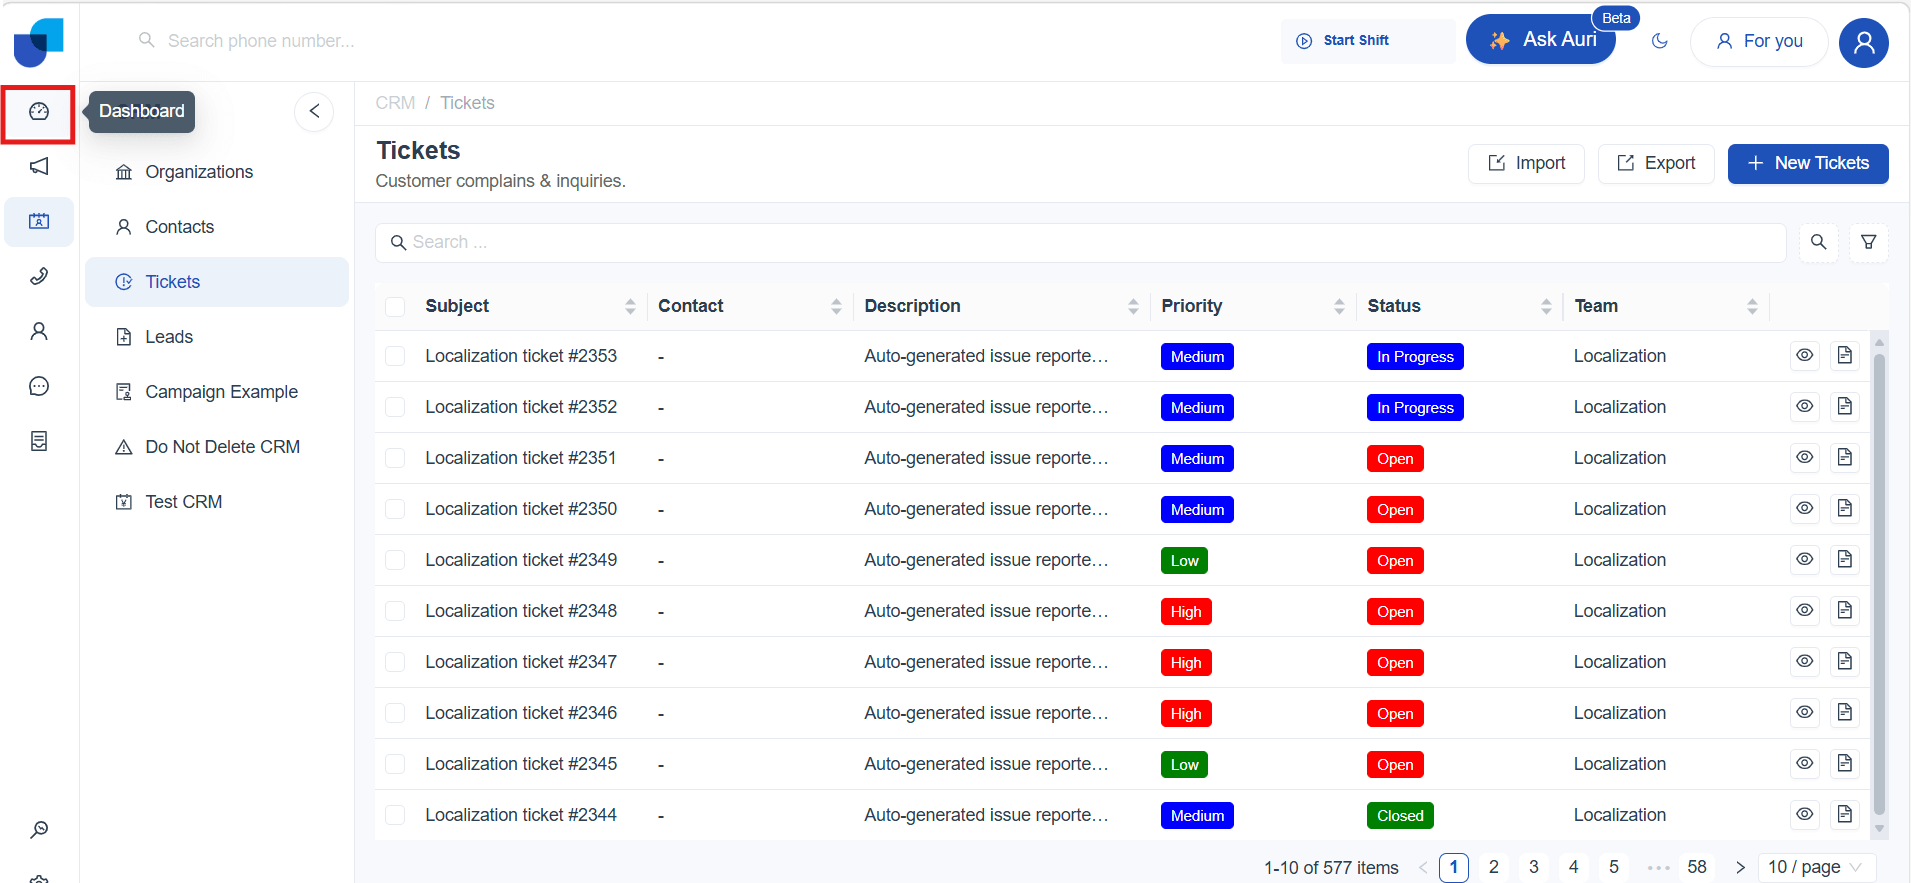
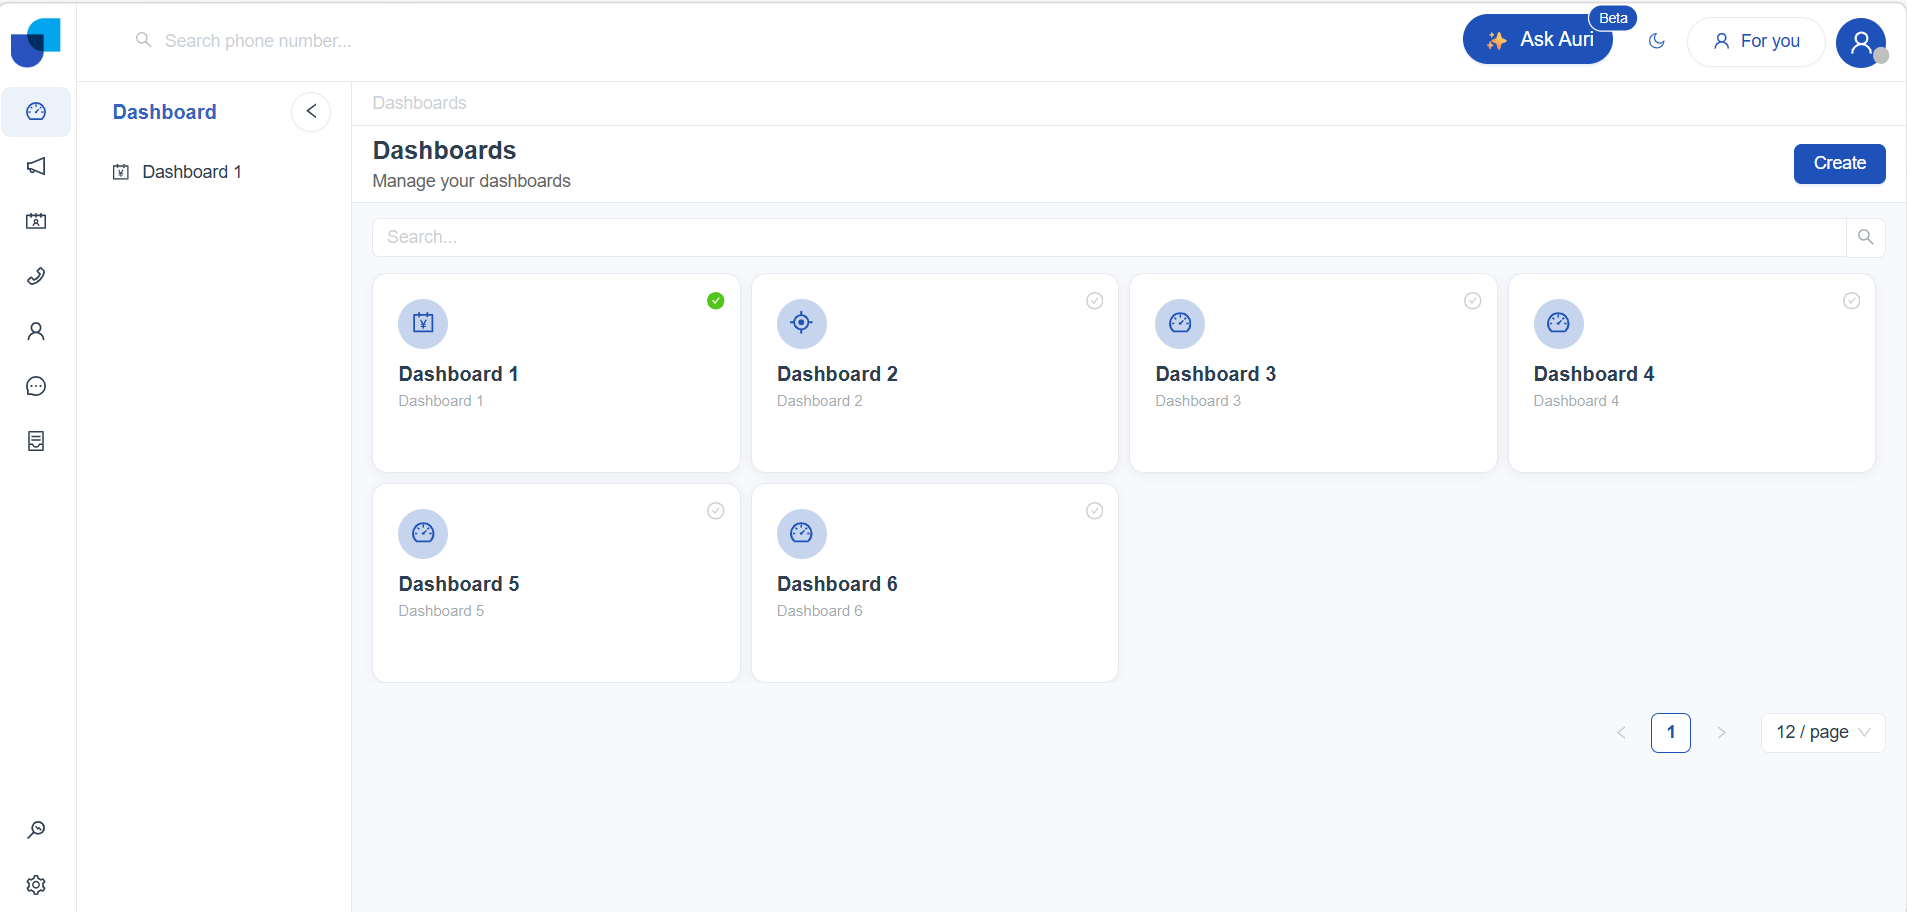
This opens the main Dashboard page, where all the existing Dashboards are displayed in tile format.
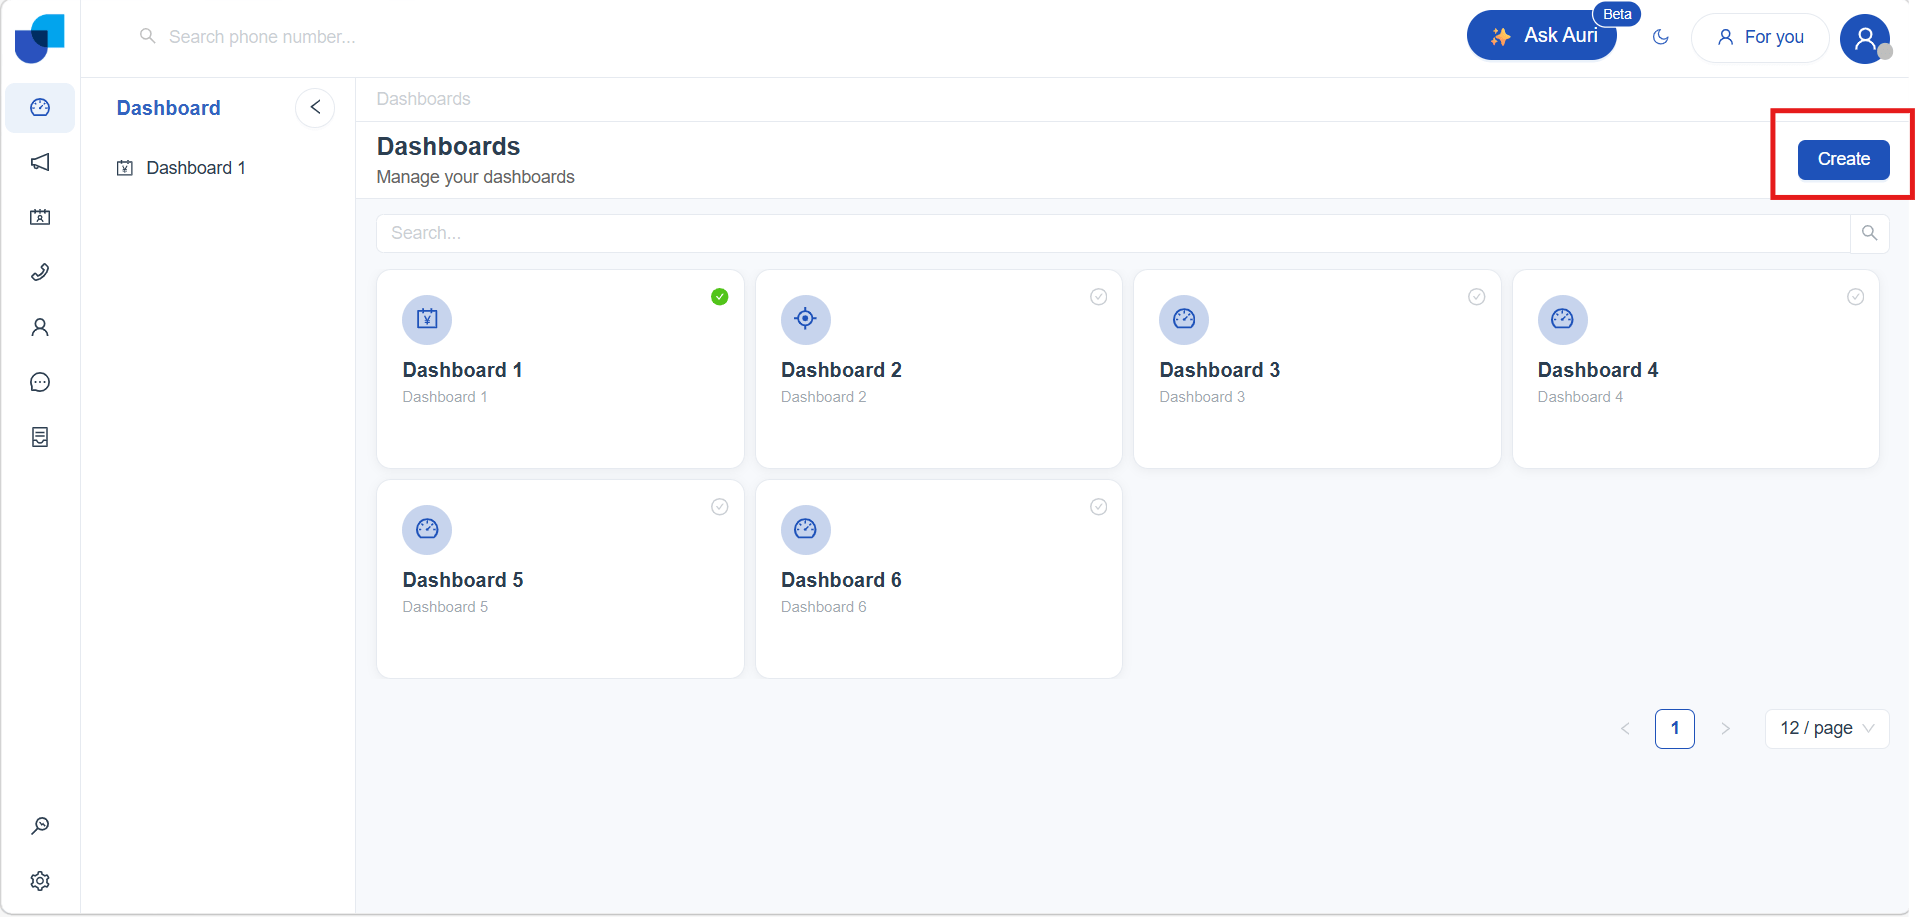
Once you're on the Dashboard page, follow these steps to create a new report:
- Click Create (top‑right corner).
- A Create Item dialog appears. Fill in:
- Title – Name of your dashboard (required)
- Description – Brief summary (required)
- Icon – Choose an icon for easy recognition
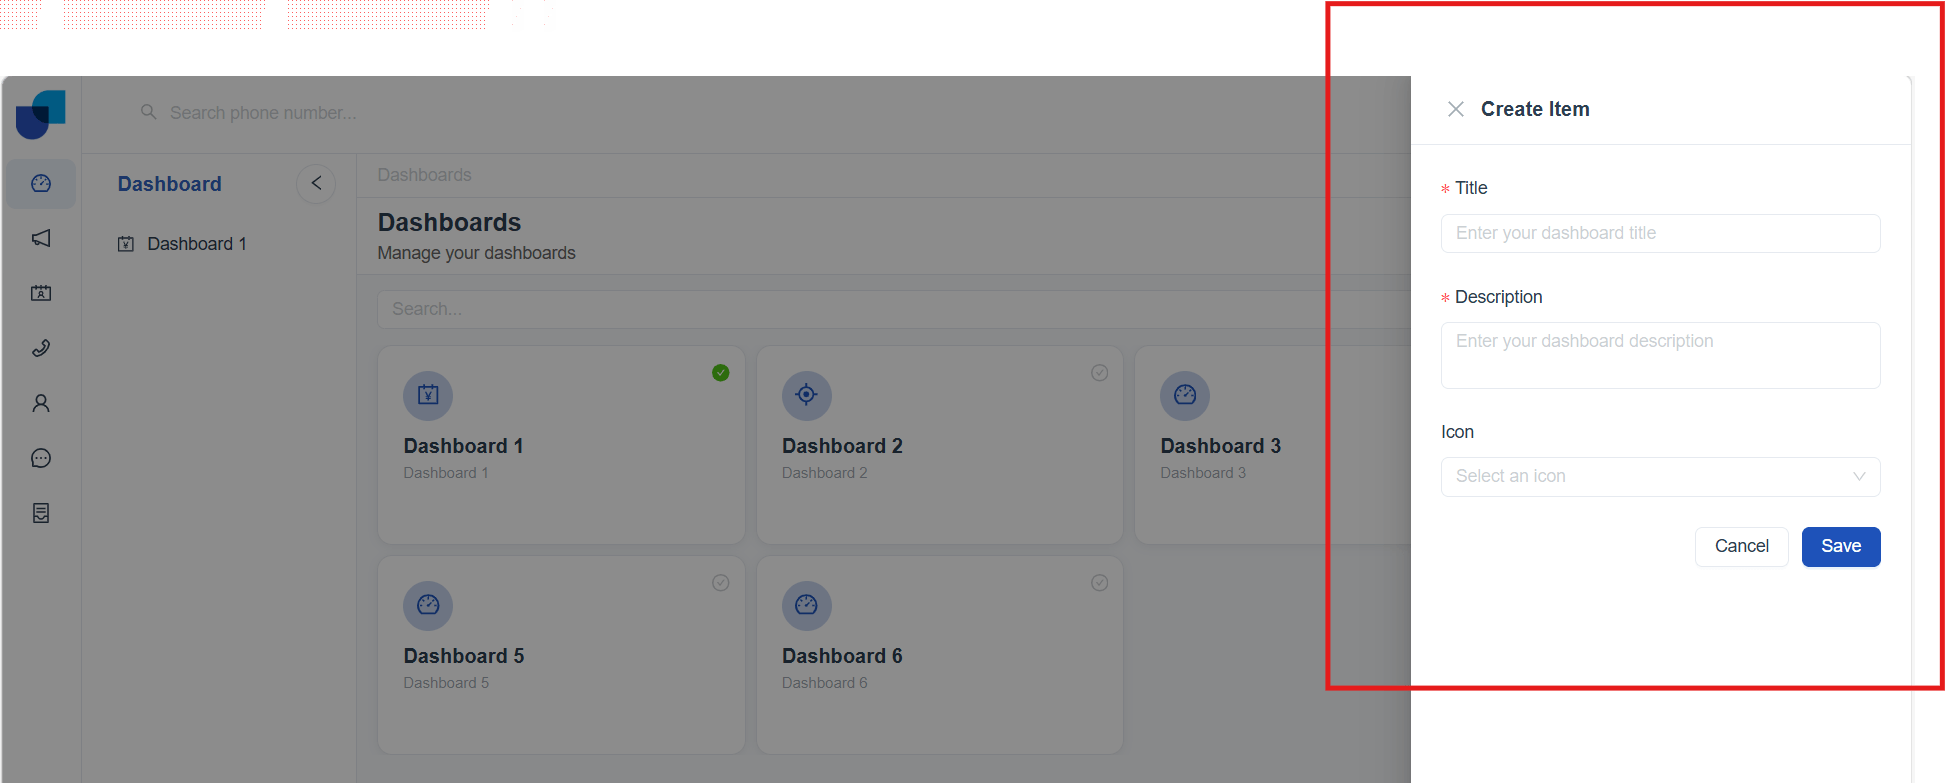
- After filling in the required fields, click Save to create your dashboard.
New dashboard will now appear on the dashboards page. Click it to open the dashboard work space and begin building visuals.
Dashboard Configurations
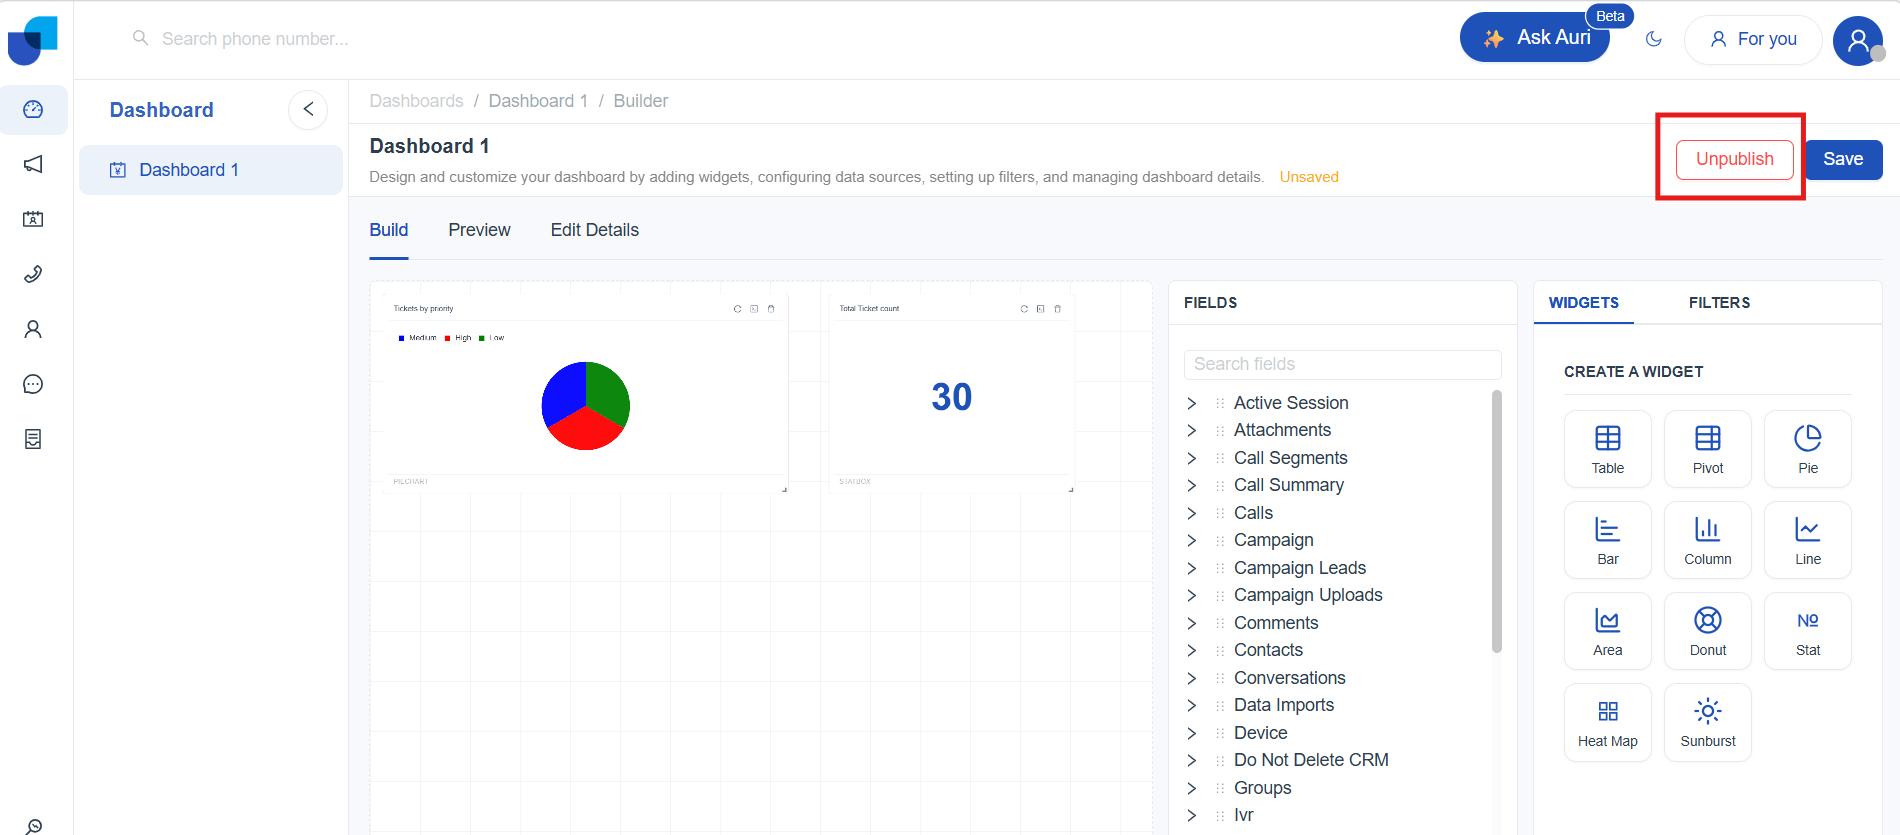
Once a dashboard is created, UniConnect opens the Builder interface, where you can configure and organize your dashboard content. The builder includes three tabs Build, Preview, and Edit Details that guide you through designing the dashboard layout, reviewing how it appears to users, and managing dashboard settings.
To Learn More on Dashboard Configuration : (link to Report configurations)
Meta Palette
The Meta Data Palette provides a complete list of all available modules that can be used while designing dashboards. Each category can be expanded to view its fields, which can be added to dashboard widgets to structure and visualize data effectively. A search option is available to quickly locate specific fields within the palette.
To Learn More on Meta Palette : (link to Report-Meta palette)
Widget Panel
The Widgets Panel provides all available visualization options for designing dashboards. From here, different widget types such as charts, tables, pivots, and metrics can be added to the dashboard canvas. Each widget is designed to highlight specific insights, enabling data to be viewed, compared, and explored effectively within a single dashboard view.

Design Dashboard with Widgets
Use widgets to bring your dashboard to life by combining charts, tables, metrics, and filters into a unified visual experience. Widgets help transform raw data into clear, interactive insights that can be easily scanned and understood at a glance. By thoughtfully selecting and arranging widgets, dashboards can highlight key trends, performance indicators, and comparisons, enabling users to monitor information efficiently from a single view.
To Learn More on Widgets : (link to Report-Design report with widgets)
Widget Configuration
The Widget Configuration section allows you to customize each widget within a dashboard based on the data and insights you want to present. Configuration options enable control over how data is grouped, summarized, filtered, and displayed. Each widget type supports its own set of configuration settings, allowing dashboards to be tailored to specific visualization and analysis needs.
Widget Configuration includes:
-
Time Configuration
-
Sorting
-
Raw Limit
-
Tool Tip Configuration
-
Widget Layout
-
Filters
To Learn More on Widget Configurations : (link to Report-Widget configurations)
Filters
Filters in UniConnect dashboards help refine and control the data displayed within dashboard widgets. Applying filters allows dashboards to present focused and relevant data sets based on selected criteria, making insights easier to analyze and interpret.
UniConnect dashboards support two types of filters:
-
Widget Filters
-
Global Filters
To Learn More on Filters : (link to Report-Filters)
Dashboard Publish and View
How to Publish a Dashboard
If you have the required permissions (link to permission), you can publish the dashboard so it becomes visible to other users.
Here’s how to publish:
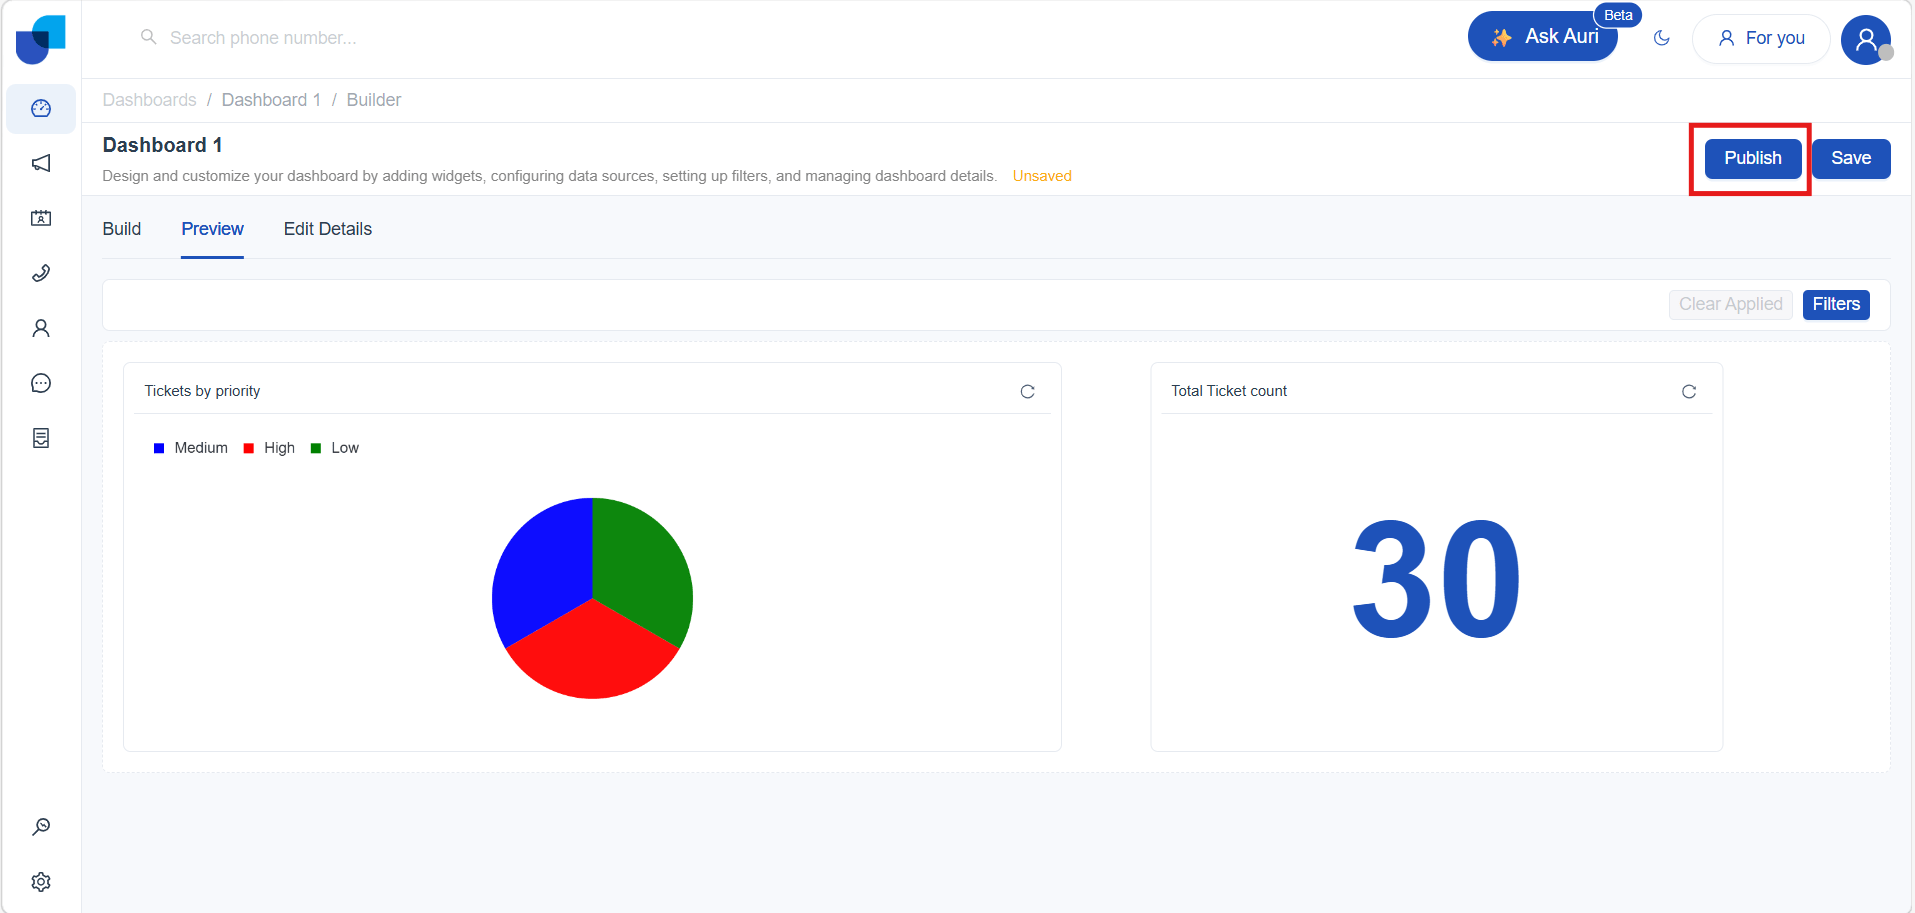
- Open the Dashboard you want to share.
- Click Publish.
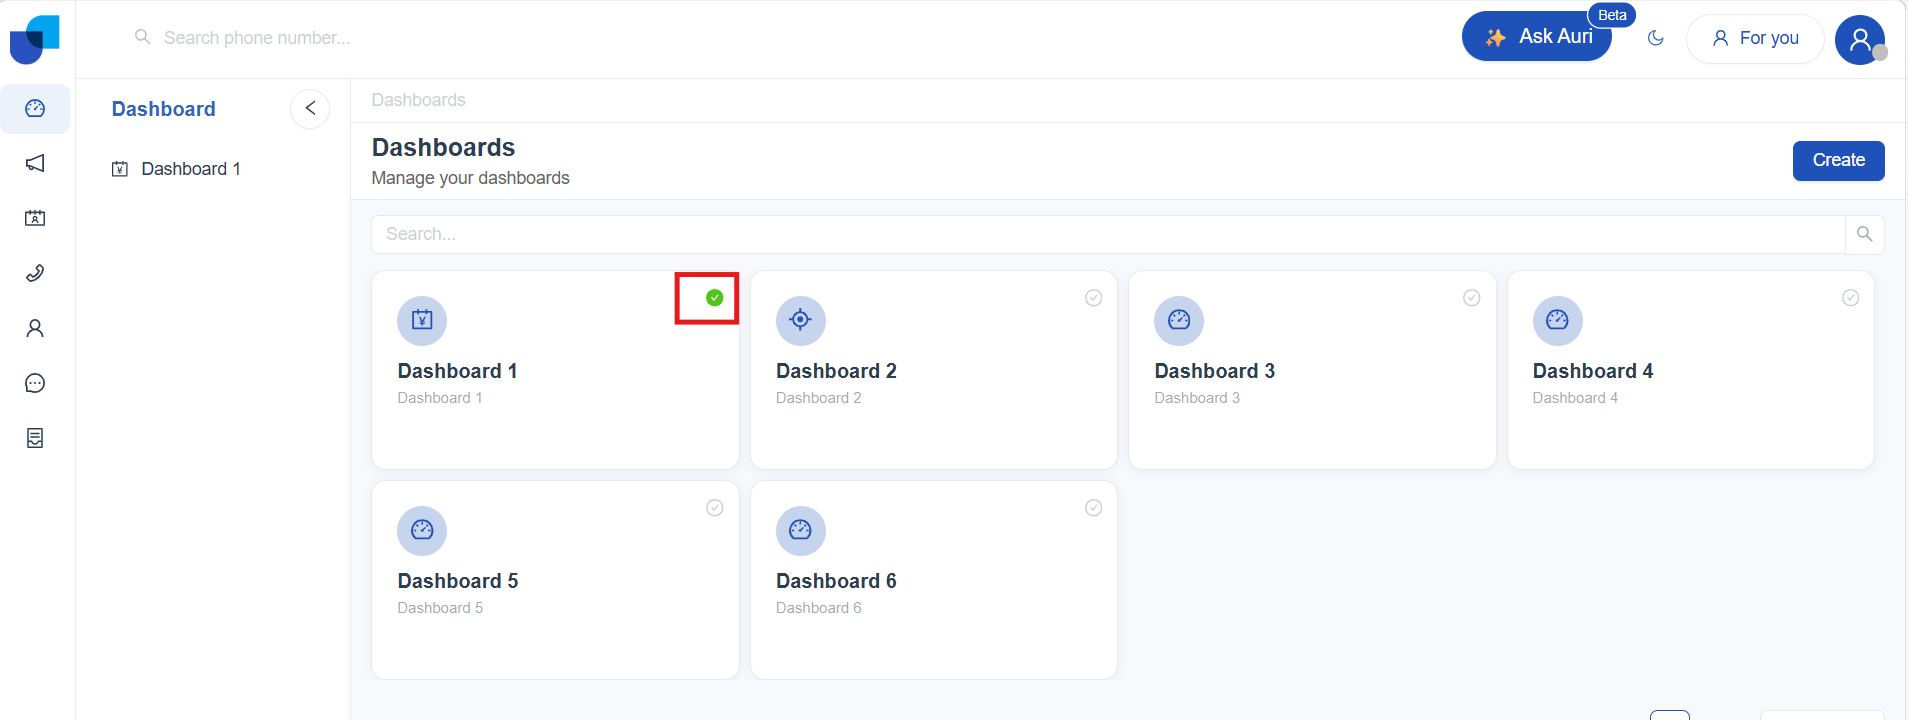
Once published:
- The dashboard becomes visible to all authorized users.
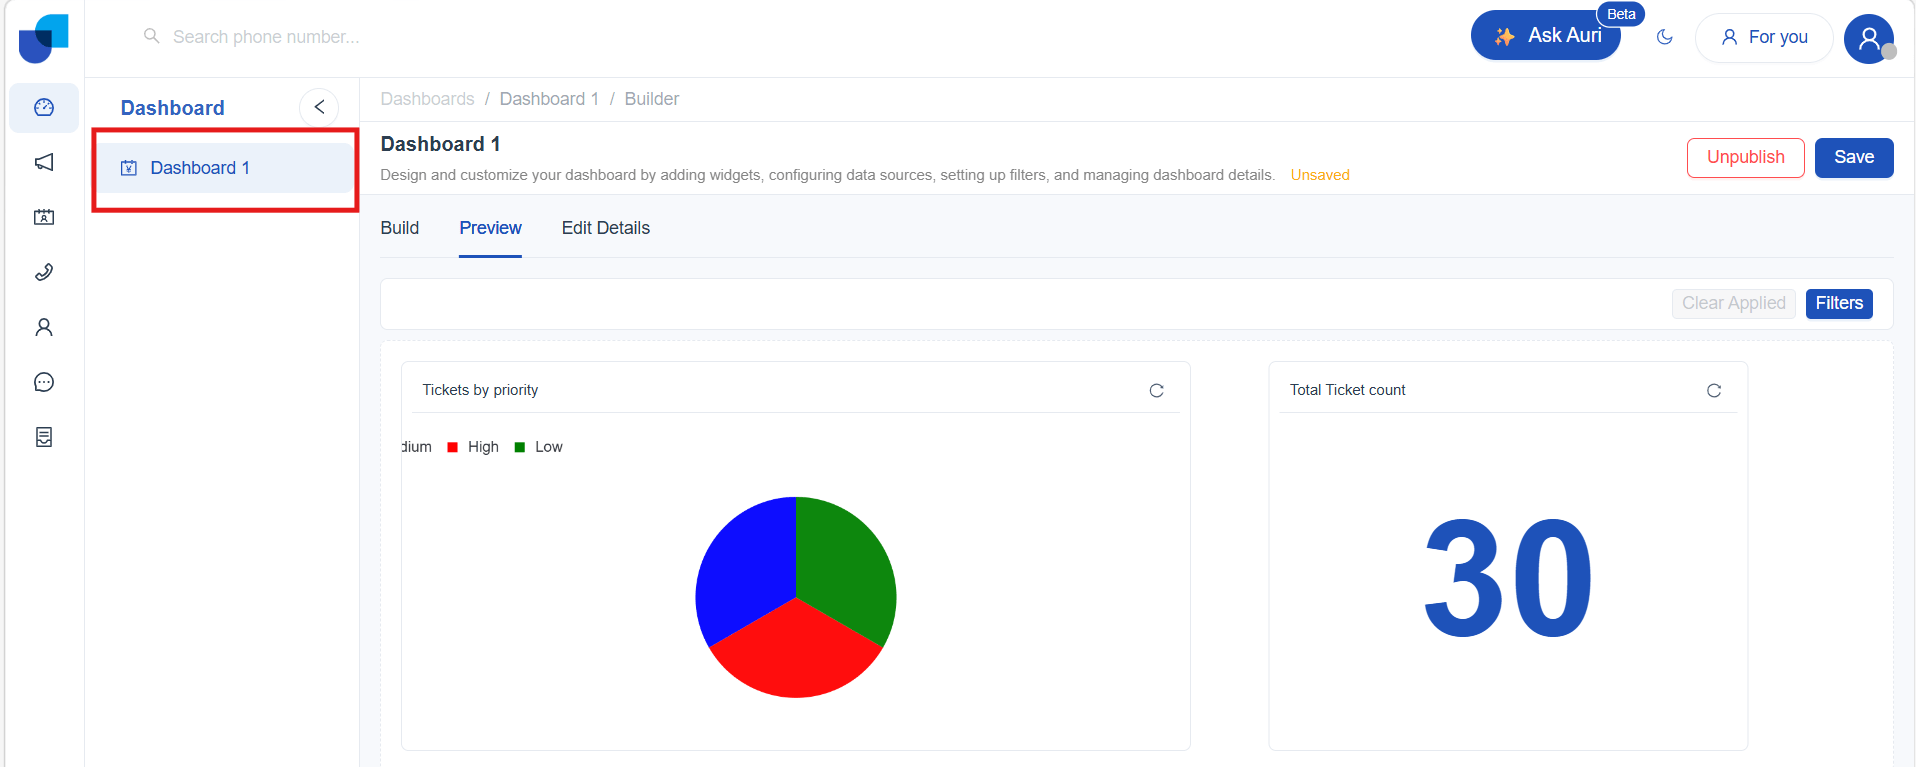
- It automatically appears in the left sidebar report list.
- A green check‑mark icon indicates it is published.
To unpublish:
- Open the dashboard and go to Edit mode
- Click Unpublish, The dashboard will no longer be visible to other users.
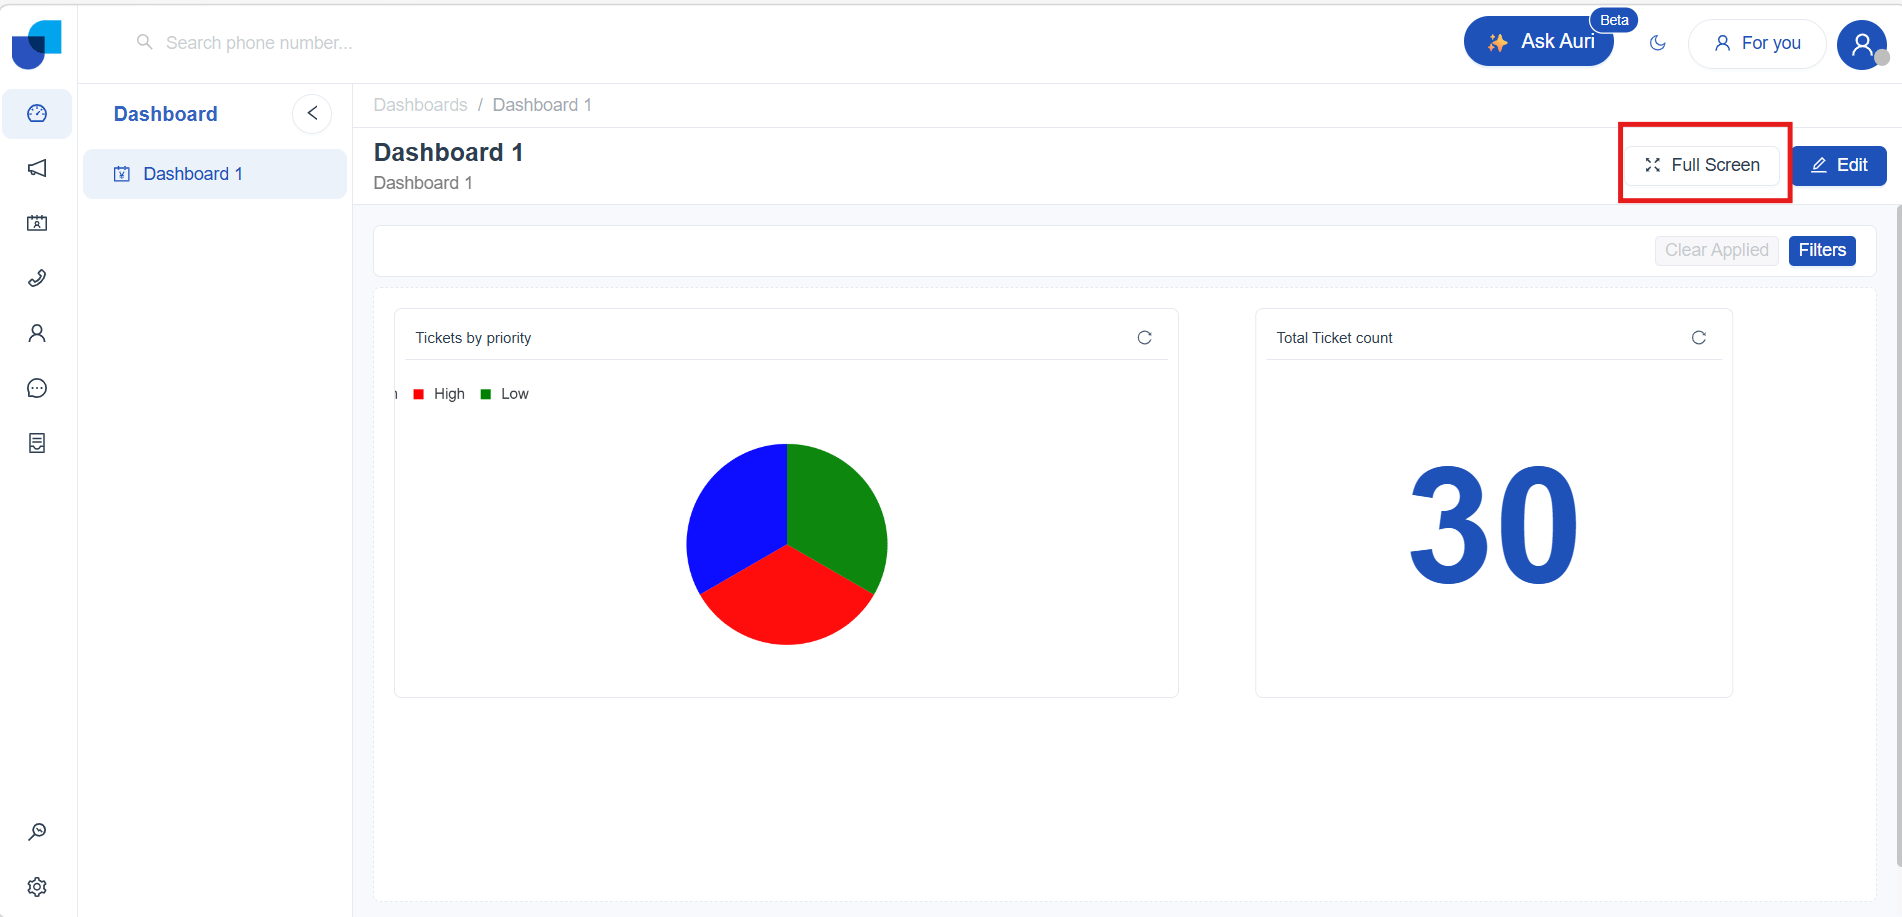
Dashboard Full Screen View
Dashboards include a Full Screen option that allows users to expand the dashboard to occupy the entire screen. This view is ideal for monitoring displays, and focused analysis.
To view a dashboard in full screen mode:
-
Open the dashboard.
-
Click Full Screen in the top‑right corner of the dashboard.