Workflow Monitoring
Workflow Monitoring in Uniconnect provides real-time visibility into the execution of automation workflows. It helps administrators track performance, troubleshoot issues, and ensure that business processes are running smoothly and reliably.
What Is Workflow Monitoring?
Workflow Monitoring is a centralized dashboard that displays the status of all automation executions. It shows:
- Which workflows were triggered
- When they started and completed
- Whether they succeeded or failed
- Node-level details for each step in the workflow
This feature is essential for system administrators, operations managers, and developers who need to validate workflow behavior and maintain operational integrity.
Accessing the Monitoring Dashboard
To access Workflow Monitoring:
- Navigate to Monitoring → Automation in the left sidebar.
- The Automation Execution Monitor will open, displaying a table of recent workflow executions.
Dashboard Overview
The main table includes the following columns:
| Column | Description |
|---|---|
| ID | Unique identifier for the workflow execution instance. |
| Workflow | Name of the workflow that was triggered. |
| Status | Execution status (e.g., COMPLETED, FAILED, DELAYED). |
| Started At | Timestamp when the workflow began. |
| Completed At | Timestamp when the workflow finished. |
| Error | Any error messages or failure indicators. |
Statuses are color-coded for quick scanning:
- ✅ COMPLETED – Workflow executed successfully.
- ⚠️ FAILED – Workflow encountered an error.
- ⏳ DELAYED – Workflow is paused due to a delay node.
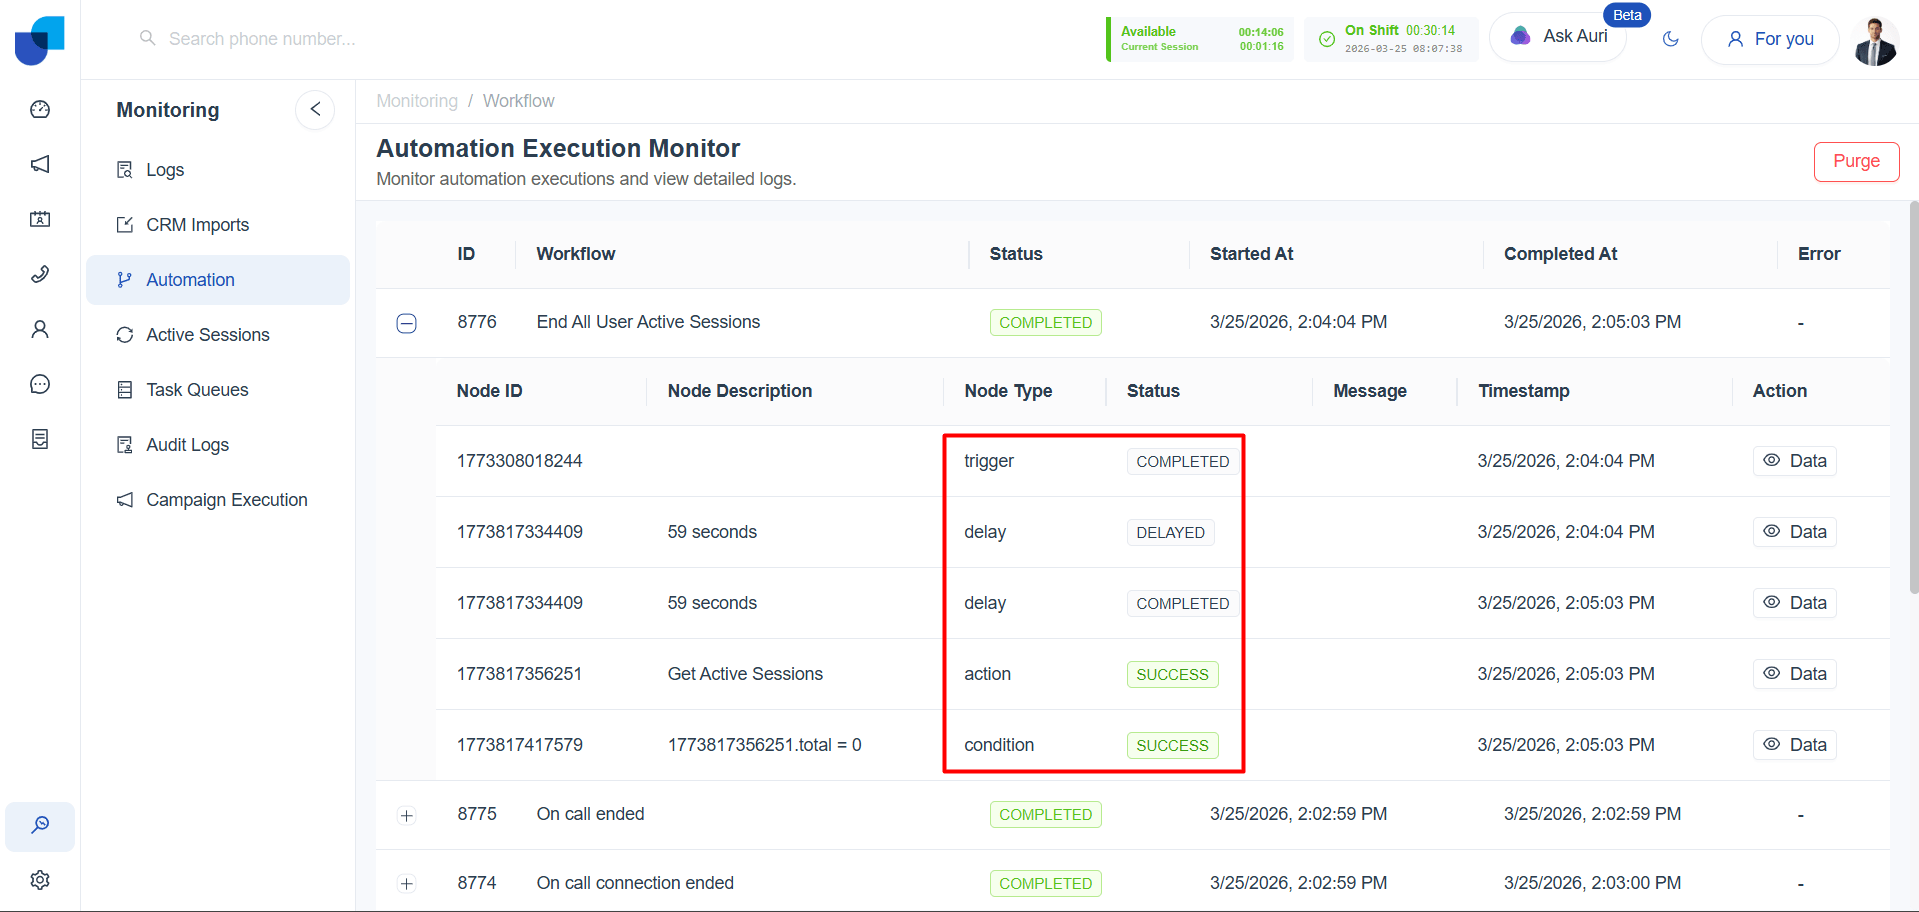
Viewing Node-Level Execution
Clicking on a workflow row reveals detailed execution logs for each node:
| Node Field | Description |
|---|---|
| Node ID | Unique identifier for the node. |
| Node Description | Label or name of the node (e.g., “Get Active Sessions”). |
| Node Type | Type of node (trigger, action, condition, delay). |
| Status | Execution result for the node (e.g., SUCCESS, COMPLETED, DELAYED). |
| Message | Any system messages or output from the node. |
| Timestamp | When the node executed. |
| Action | Option to view node data or logs. |
This breakdown allows users to pinpoint exactly where a workflow succeeded, paused, or failed.
Common Monitoring Scenarios
✅ Success Case
- Workflow: End All User Active Sessions
- Trigger: User All Session Ended
- Nodes: Trigger → Delay → Action → Condition
- Status: All nodes marked COMPLETED or SUCCESS
- Outcome: User sessions ended and status updated as expected.
⚠️ Failure Case
- Workflow: Send Follow-Up Email
- Trigger: Disposition Submitted
- Error: Email template missing or invalid recipient
- Resolution: Check action node message, update template or data source.
Best Practices for Monitoring
- Check regularly: Review the monitor daily to catch failures early.
- Investigate delays: If workflows are stuck in DELAYED status, verify delay configurations and downstream dependencies.
- Use node logs: Node-level messages help diagnose issues faster than workflow-level summaries.
- Filter by workflow name or date: Narrow results to specific workflows or timeframes for focused analysis.
- Audit failed workflows: Re-run or clone failed workflows after resolving the root cause.
Troubleshooting Tips
- Missing data: Check if the trigger node received valid input.
- Failed actions: Review the action node’s message for API errors or missing fields.
- Unmet conditions: Confirm that condition logic matches expected data formats.
- Unexpected delays: Ensure delay durations are intentional and not misconfigured.
Key Takeaway
Workflow Monitoring gives you full transparency into how automations behave in real time. By reviewing execution logs, node statuses, and error messages, you can maintain system reliability, troubleshoot issues quickly, and optimize workflow performance across your organization.