Built-in Dashboards
These are the four built-in dashboards that ship with Uniconnect AI. All four are owned by System User, a system account, rather than a real person.
- CRM Executive & Support Overview
- My Workspace (Agent Desk)
- Inbound Live & Queue Monitor
- Outbound Campaigns Monitor
All four share the identical action set: Full Screen, Share, and Duplicate. None of the four shows an Edit button. To change one, Duplicate it first, exactly as described in Built-in Starter Content on the Getting Started page.
CRM Executive & Support Overview
A single screen summary built for anyone who needs the state of support and sales at a glance, rather than the full record level detail. It pulls from three separate CRM modules at once, Support Ticket for the ticket counts, Leads for the pipeline figures, and Accounts for the customer count, with each widget querying its own module independently. Four Stat tiles sit across the top for an instant read, backed by two column charts underneath that break the same ticket and lead populations down by status and by pipeline stage. Every widget reads live CRM data with no snapshot or refresh delay, so the numbers shown here move the moment a ticket is closed or a lead changes stage anywhere else in the platform.
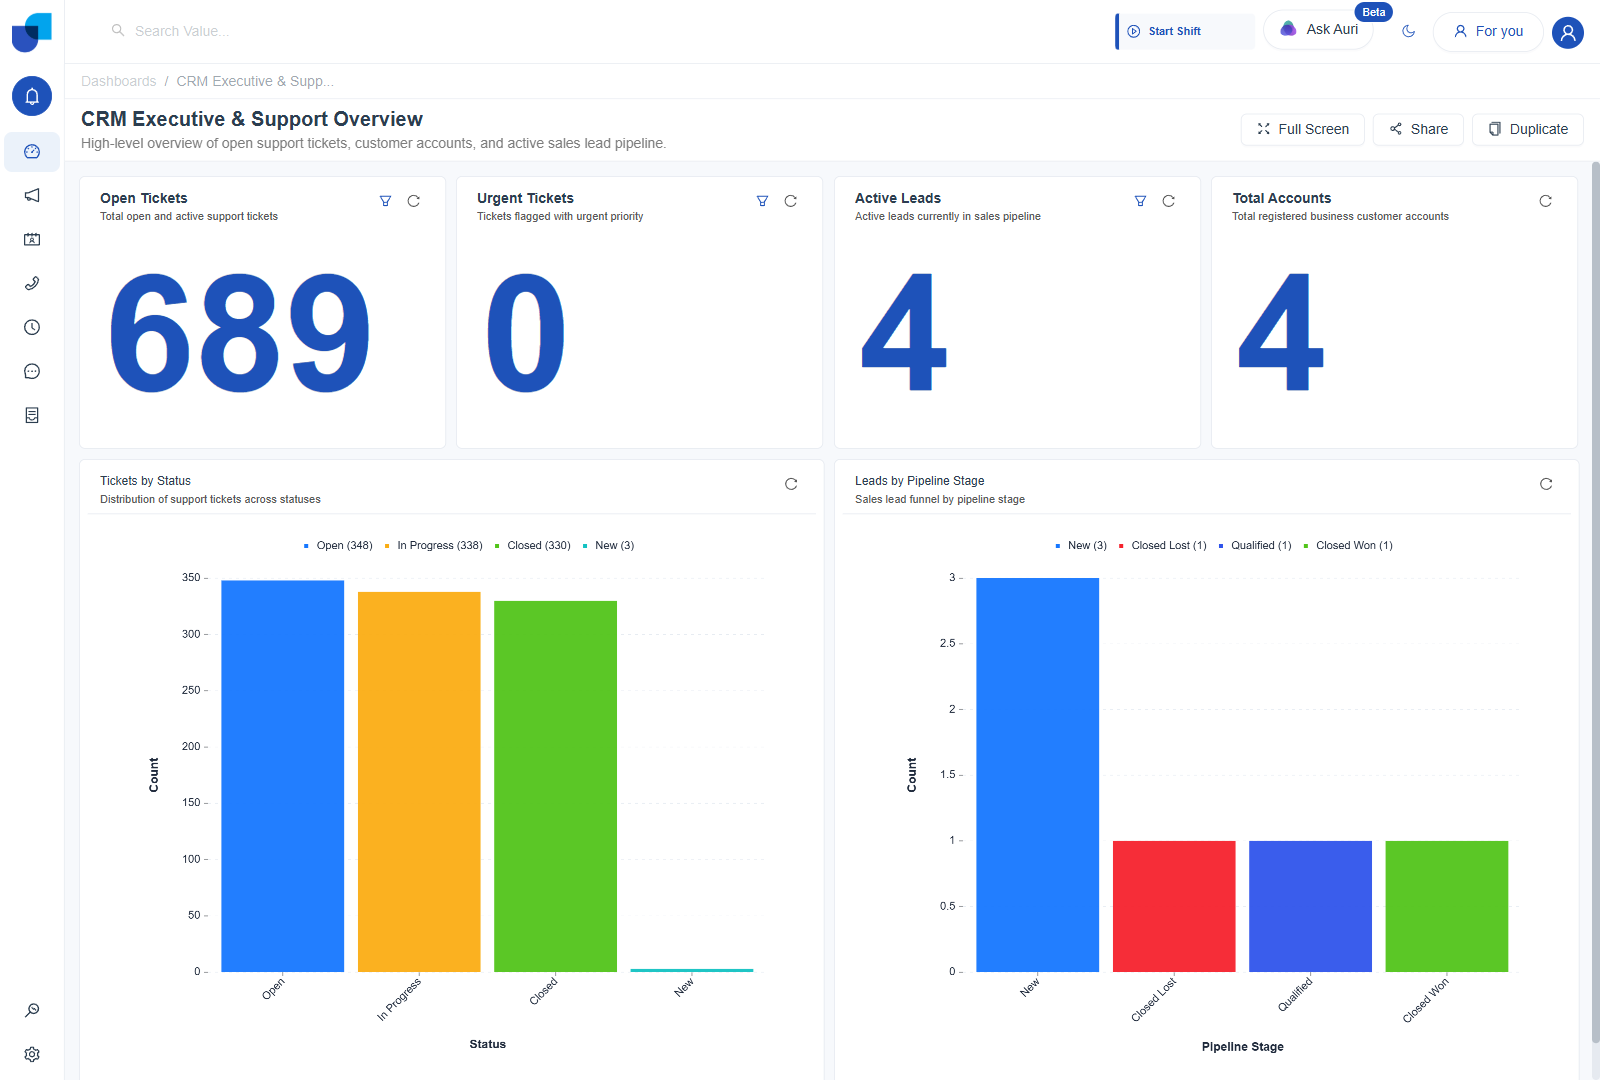
Figure 1. Open Tickets reading 689, alongside Urgent Tickets, Active Leads, and Total Accounts.
| Widget | Type | Logic | Shows |
|---|---|---|---|
| Open Tickets | Stat | Count measure on the Support Ticket module, filtered to open and active statuses. | Total open and active support tickets. Reading 689. |
| Urgent Tickets | Stat | Count measure on the Support Ticket module, filtered to urgent priority. | Tickets flagged with urgent priority. Reading 0. |
| Active Leads | Stat | Count measure on the Leads module, filtered to active pipeline stages. | Active leads currently in sales pipeline. Reading 4. |
| Total Accounts | Stat | Count measure on the Accounts module, no filter applied. | Total registered business customer accounts. Reading 4. |
| Tickets by Status | Column chart | Count measure on the Support Ticket module, grouped by the Status dimension. | Distribution of support tickets across statuses. Open 348, In Progress 338, Closed 330, New 3. |
| Leads by Pipeline Stage | Column chart | Count measure on the Leads module, grouped by the Pipeline Stage dimension. | Sales lead funnel by pipeline stage. New 3, Closed Lost 1, Qualified 1, Closed Won 1. |
My Workspace (Agent Desk)
A personal, agent facing counterpart to the executive dashboard above, built around the same underlying ticket and lead data but reframed around one individual's immediate queue rather than the whole organization. The four Stat tiles mirror CRM Executive & Support Overview's figures closely, since this seeded build carries no per-agent assignment filter, so My Open Tickets and My Urgent Tickets currently read the same organization wide totals as Open Tickets and Urgent Tickets do elsewhere. The real differentiator is the Recent Tickets Queue table underneath, a full, paginated list of 1,019 individual tickets rather than a single aggregated number, intended as the place an agent would actually click into their next piece of work. A Leads by Pipeline Stage chart closes out the dashboard, repeating the same funnel breakdown shown on the executive view.
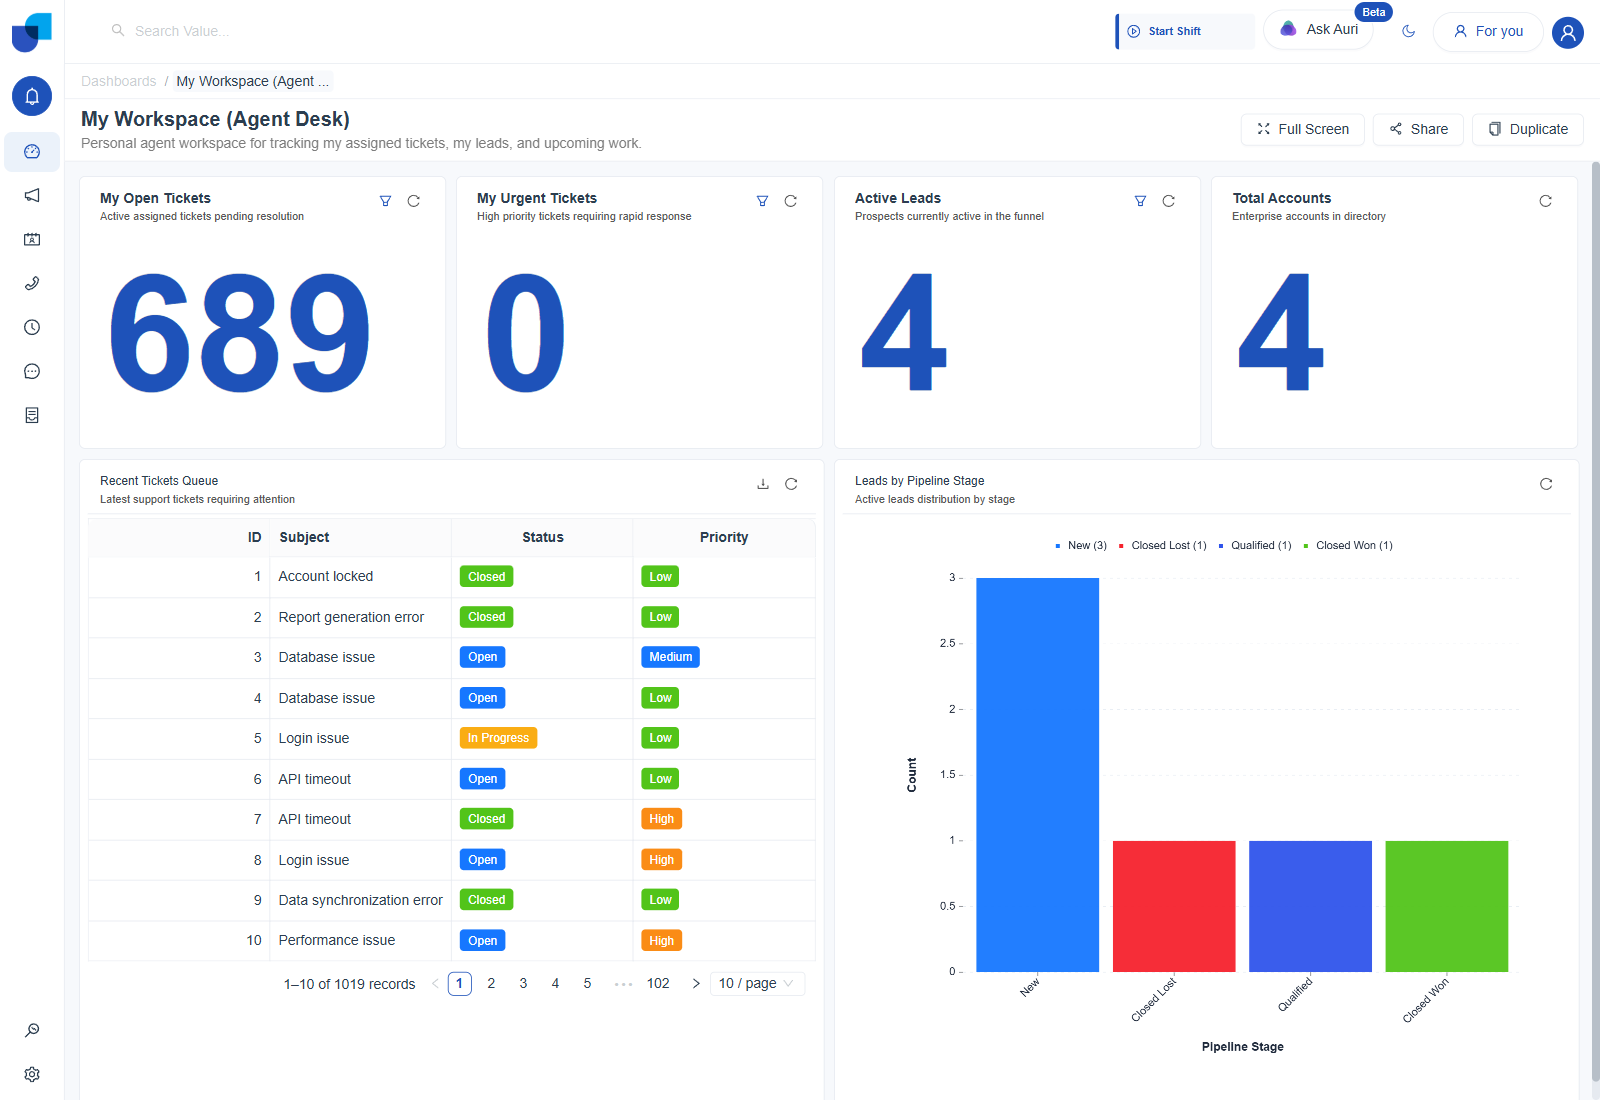
Figure 2. My Workspace (Agent Desk): four Stat tiles, a 1,019 row Recent Tickets Queue table, and a Leads by Pipeline Stage chart.
| Widget | Type | Logic | Shows |
|---|---|---|---|
| My Open Tickets | Stat | Count measure on the Support Ticket module, filtered to open and active statuses. Same underlying query as Open Tickets on CRM Executive & Support Overview. | Active assigned tickets pending resolution. Reading 689. |
| My Urgent Tickets | Stat | Count measure on the Support Ticket module, filtered to urgent priority. | High priority tickets requiring rapid response. Reading 0. |
| Active Leads | Stat | Count measure on the Leads module, filtered to active pipeline stages. | Prospects currently active in the funnel. Reading 4. |
| Total Accounts | Stat | Count measure on the Accounts module, no filter applied. | Enterprise accounts in directory. Reading 4. |
| Recent Tickets Queue | Table | Raw Support Ticket rows, with ID, Subject, Status, and Priority dragged onto Columns. | Latest support tickets requiring attention. 1,019 rows of real tickets, color coded by Status (Open, Closed, In Progress) and Priority (Low, Medium, High). |
| Leads by Pipeline Stage | Column chart | Count measure on the Leads module, grouped by the Pipeline Stage dimension. | Active leads distribution by stage. New 3, Closed Lost 1, Qualified 1, Closed Won 1. |
Inbound Live & Queue Monitor
Default filter: Call Date, Today
The densest of the four built in dashboards, and the one built specifically for live, shift level call center monitoring rather than a historical summary. Every one of its ten regular Stat tiles reads straight off the Calls module for the Call Date default filter, Today, so the whole dashboard resets its picture each morning unless that filter chip is changed. Two further Stat tiles use the Live Ticker value type to keep counting upward in the browser between refreshes, Longest Waiting Call and Longest Active Call, intended for a wallboard a supervisor glances at rather than a report anyone reads after the fact. A column chart and a donut chart cover call volume by queue and agent presence respectively, and a final Live Active Calls table lists every call currently in progress, queue waiting, talking, or ringing, row by row.
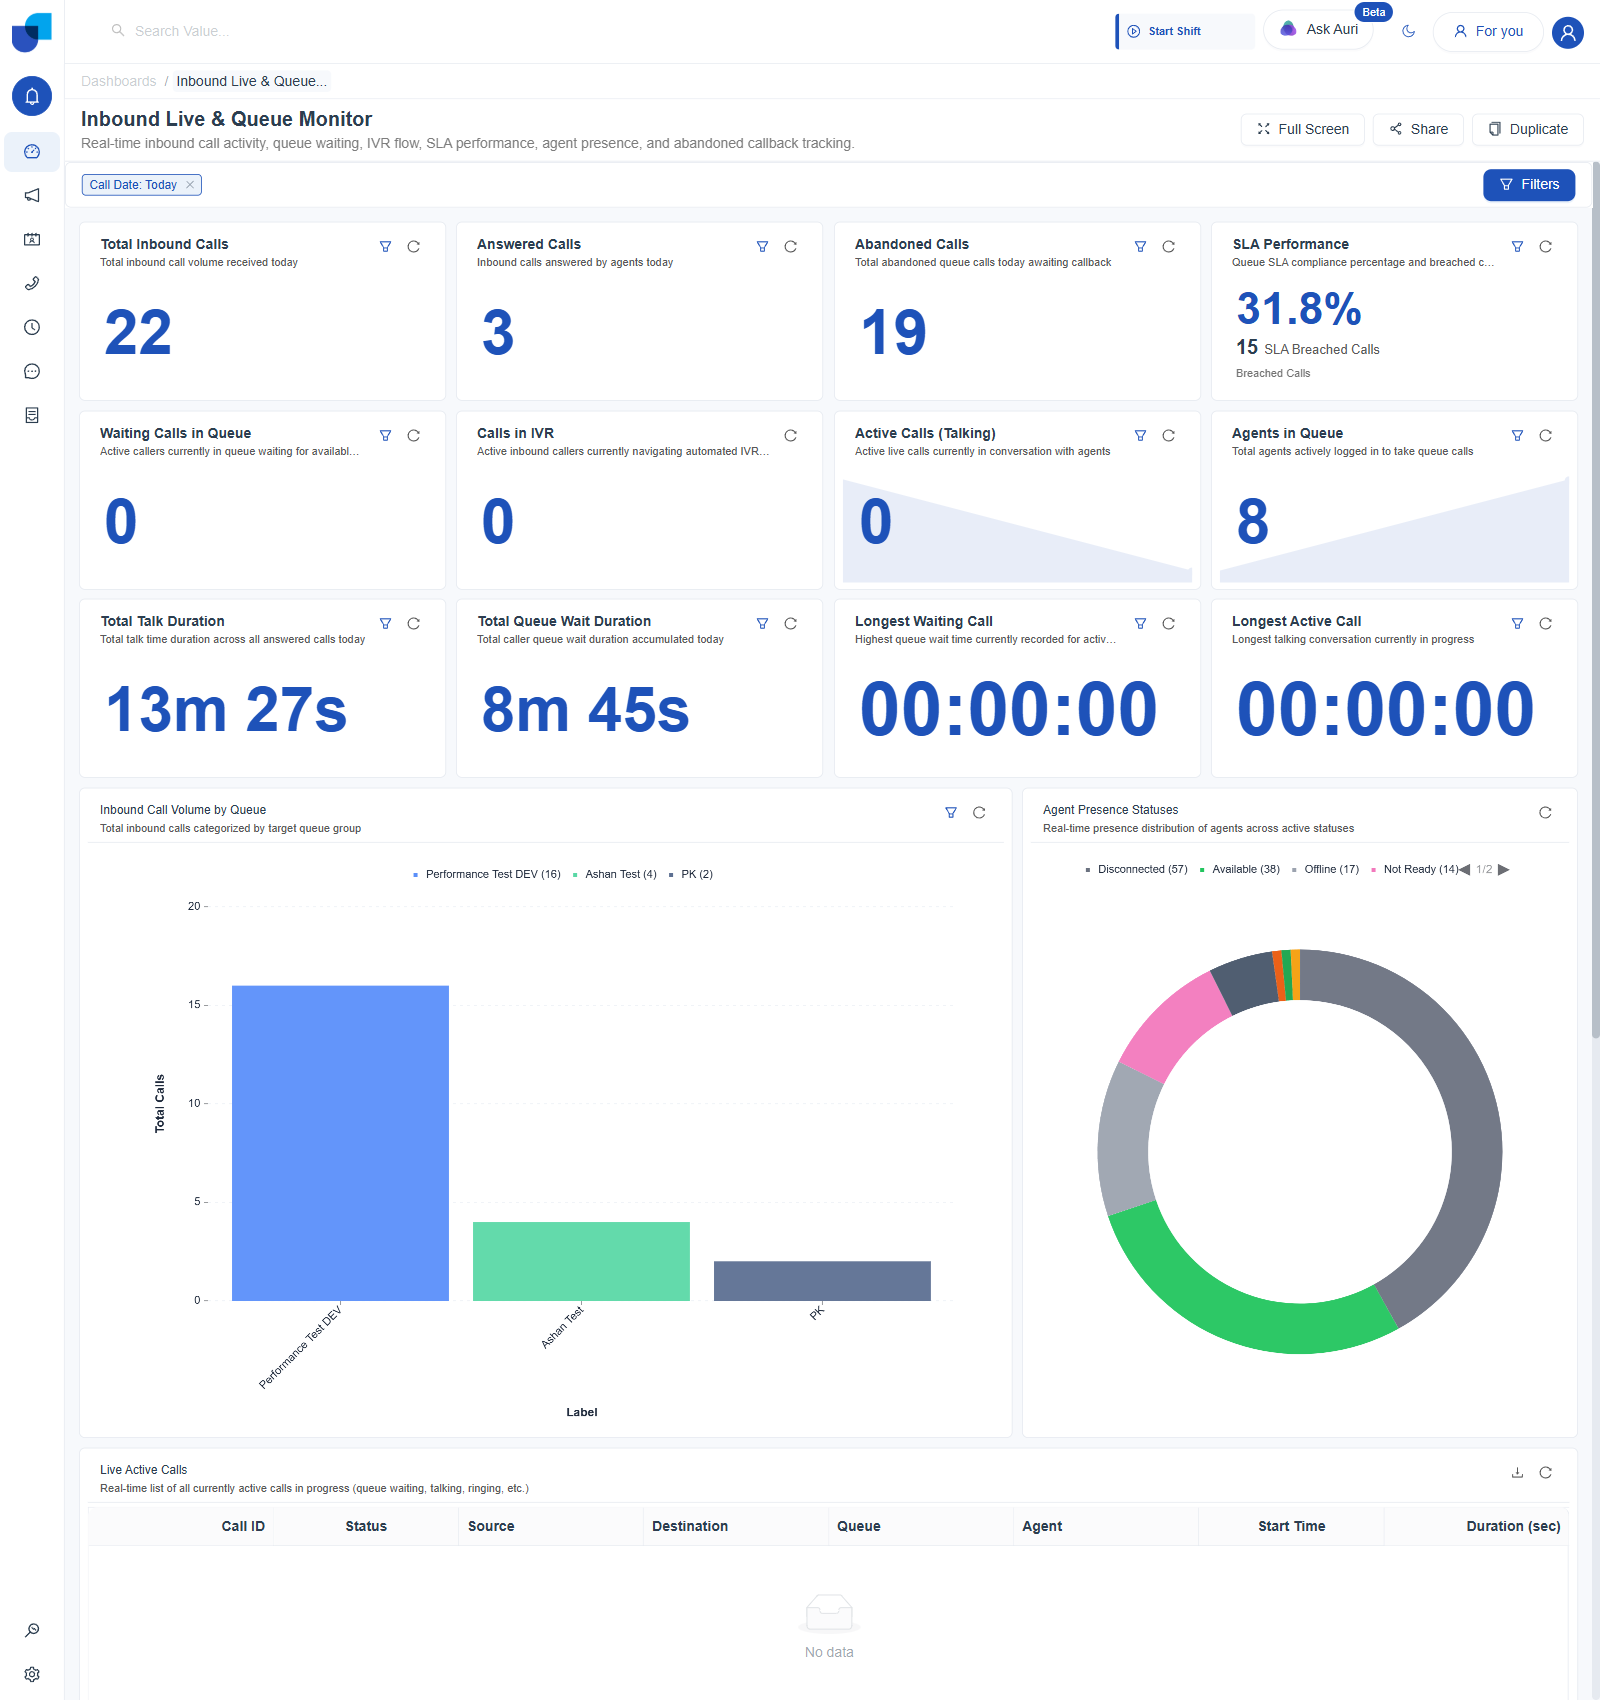
Figure 3. The densest built-in dashboard: fifteen widgets, including two Live Ticker stat tiles and a Live Active Calls table.
| Widget | Type | Logic | Shows |
|---|---|---|---|
| Total Inbound Calls | Stat | Count measure on the Calls module, filtered to inbound direction and today's Call Date. | Total inbound call volume received today. |
| Answered Calls | Stat | Count measure on the Calls module, filtered to inbound, answered, and today's Call Date. | Inbound calls answered by agents today. |
| Abandoned Calls | Stat | Count measure on the Calls module, filtered to inbound, abandoned, and today's Call Date. | Total abandoned queue calls today awaiting callback. |
| SLA Performance | Stat | A calculated percentage of calls answered within the SLA threshold, with a secondary Breached Calls count underneath. | Queue SLA compliance percentage, plus a breached calls count underneath. |
| Waiting Calls in Queue | Stat | Count measure on live queue state, filtered to callers currently waiting. | Active callers currently in queue waiting for availability. |
| Calls in IVR | Stat | Count measure on live queue state, filtered to callers currently in the IVR flow. | Active inbound callers currently navigating automated IVR. |
| Active Calls (Talking) | Stat | Count measure on live queue state, filtered to calls currently connected to an agent. | Active live calls currently in conversation with agents. |
| Agents in Queue | Stat | Count measure on agent presence, filtered to agents logged into the queue. | Total agents actively logged in to take queue calls. |
| Total Talk Duration | Stat | Sum measure of call duration on the Calls module, filtered to answered calls and today's Call Date. | Total talk time duration across all answered calls today. |
| Total Queue Wait Duration | Stat | Sum measure of queue wait time on the Calls module, filtered to today's Call Date. | Total caller queue wait duration accumulated today. |
| Longest Waiting Call | Stat, Live Ticker | Max measure of current wait time on live queue state, rendered with the Live Ticker value type. | Highest queue wait time currently recorded for an active caller. The Live Ticker value type covered in Widget Types. |
| Longest Active Call | Stat, Live Ticker | Max measure of current talk time on live queue state, rendered with the Live Ticker value type. | Longest talking conversation currently in progress. |
| Inbound Call Volume by Queue | Column chart | Count measure on the Calls module, grouped by the target Queue dimension. | Total inbound calls categorized by target queue group. |
| Agent Presence Statuses | Donut chart | Count measure on agent presence, grouped by the Status dimension. | Real-time presence distribution of agents across active statuses: Disconnected, Available, Offline, Not Ready, and more, paginated across two pages of the legend. |
| Live Active Calls | Table | Raw live call rows, with Call ID, Status, Source, Destination, Queue, Agent, Start Time, and Duration dragged onto Columns. | Real-time list of all currently active calls in progress, queue waiting, talking, ringing. |
Outbound Campaigns Monitor
Default filter: Campaign Date, This Month
The outbound counterpart to Inbound Live & Queue Monitor, covering the full lifecycle of a dialing campaign rather than inbound queue traffic, and defaulting its global filter to Campaign Date, This Month instead of Today. Eight Stat tiles across the top cover the campaign and lead side of the funnel, running campaigns, total and connected leads, and dispositions logged, all drawn from the Campaign and Campaign Leads modules. Four chart and table widgets underneath go deeper: two of them, a donut and a column funnel, render the identical Lead Statuses Breakdown data in different shapes, while Disposition Breakdown and Dispositions by Call Type currently return no data, most likely because no disposition records have been logged against this particular campaign set yet. An Active Campaigns Directory table closes the dashboard out with the operational detail, each campaign's schedule window, channel, and retry configuration, that the Stat tiles above summarize into single numbers.
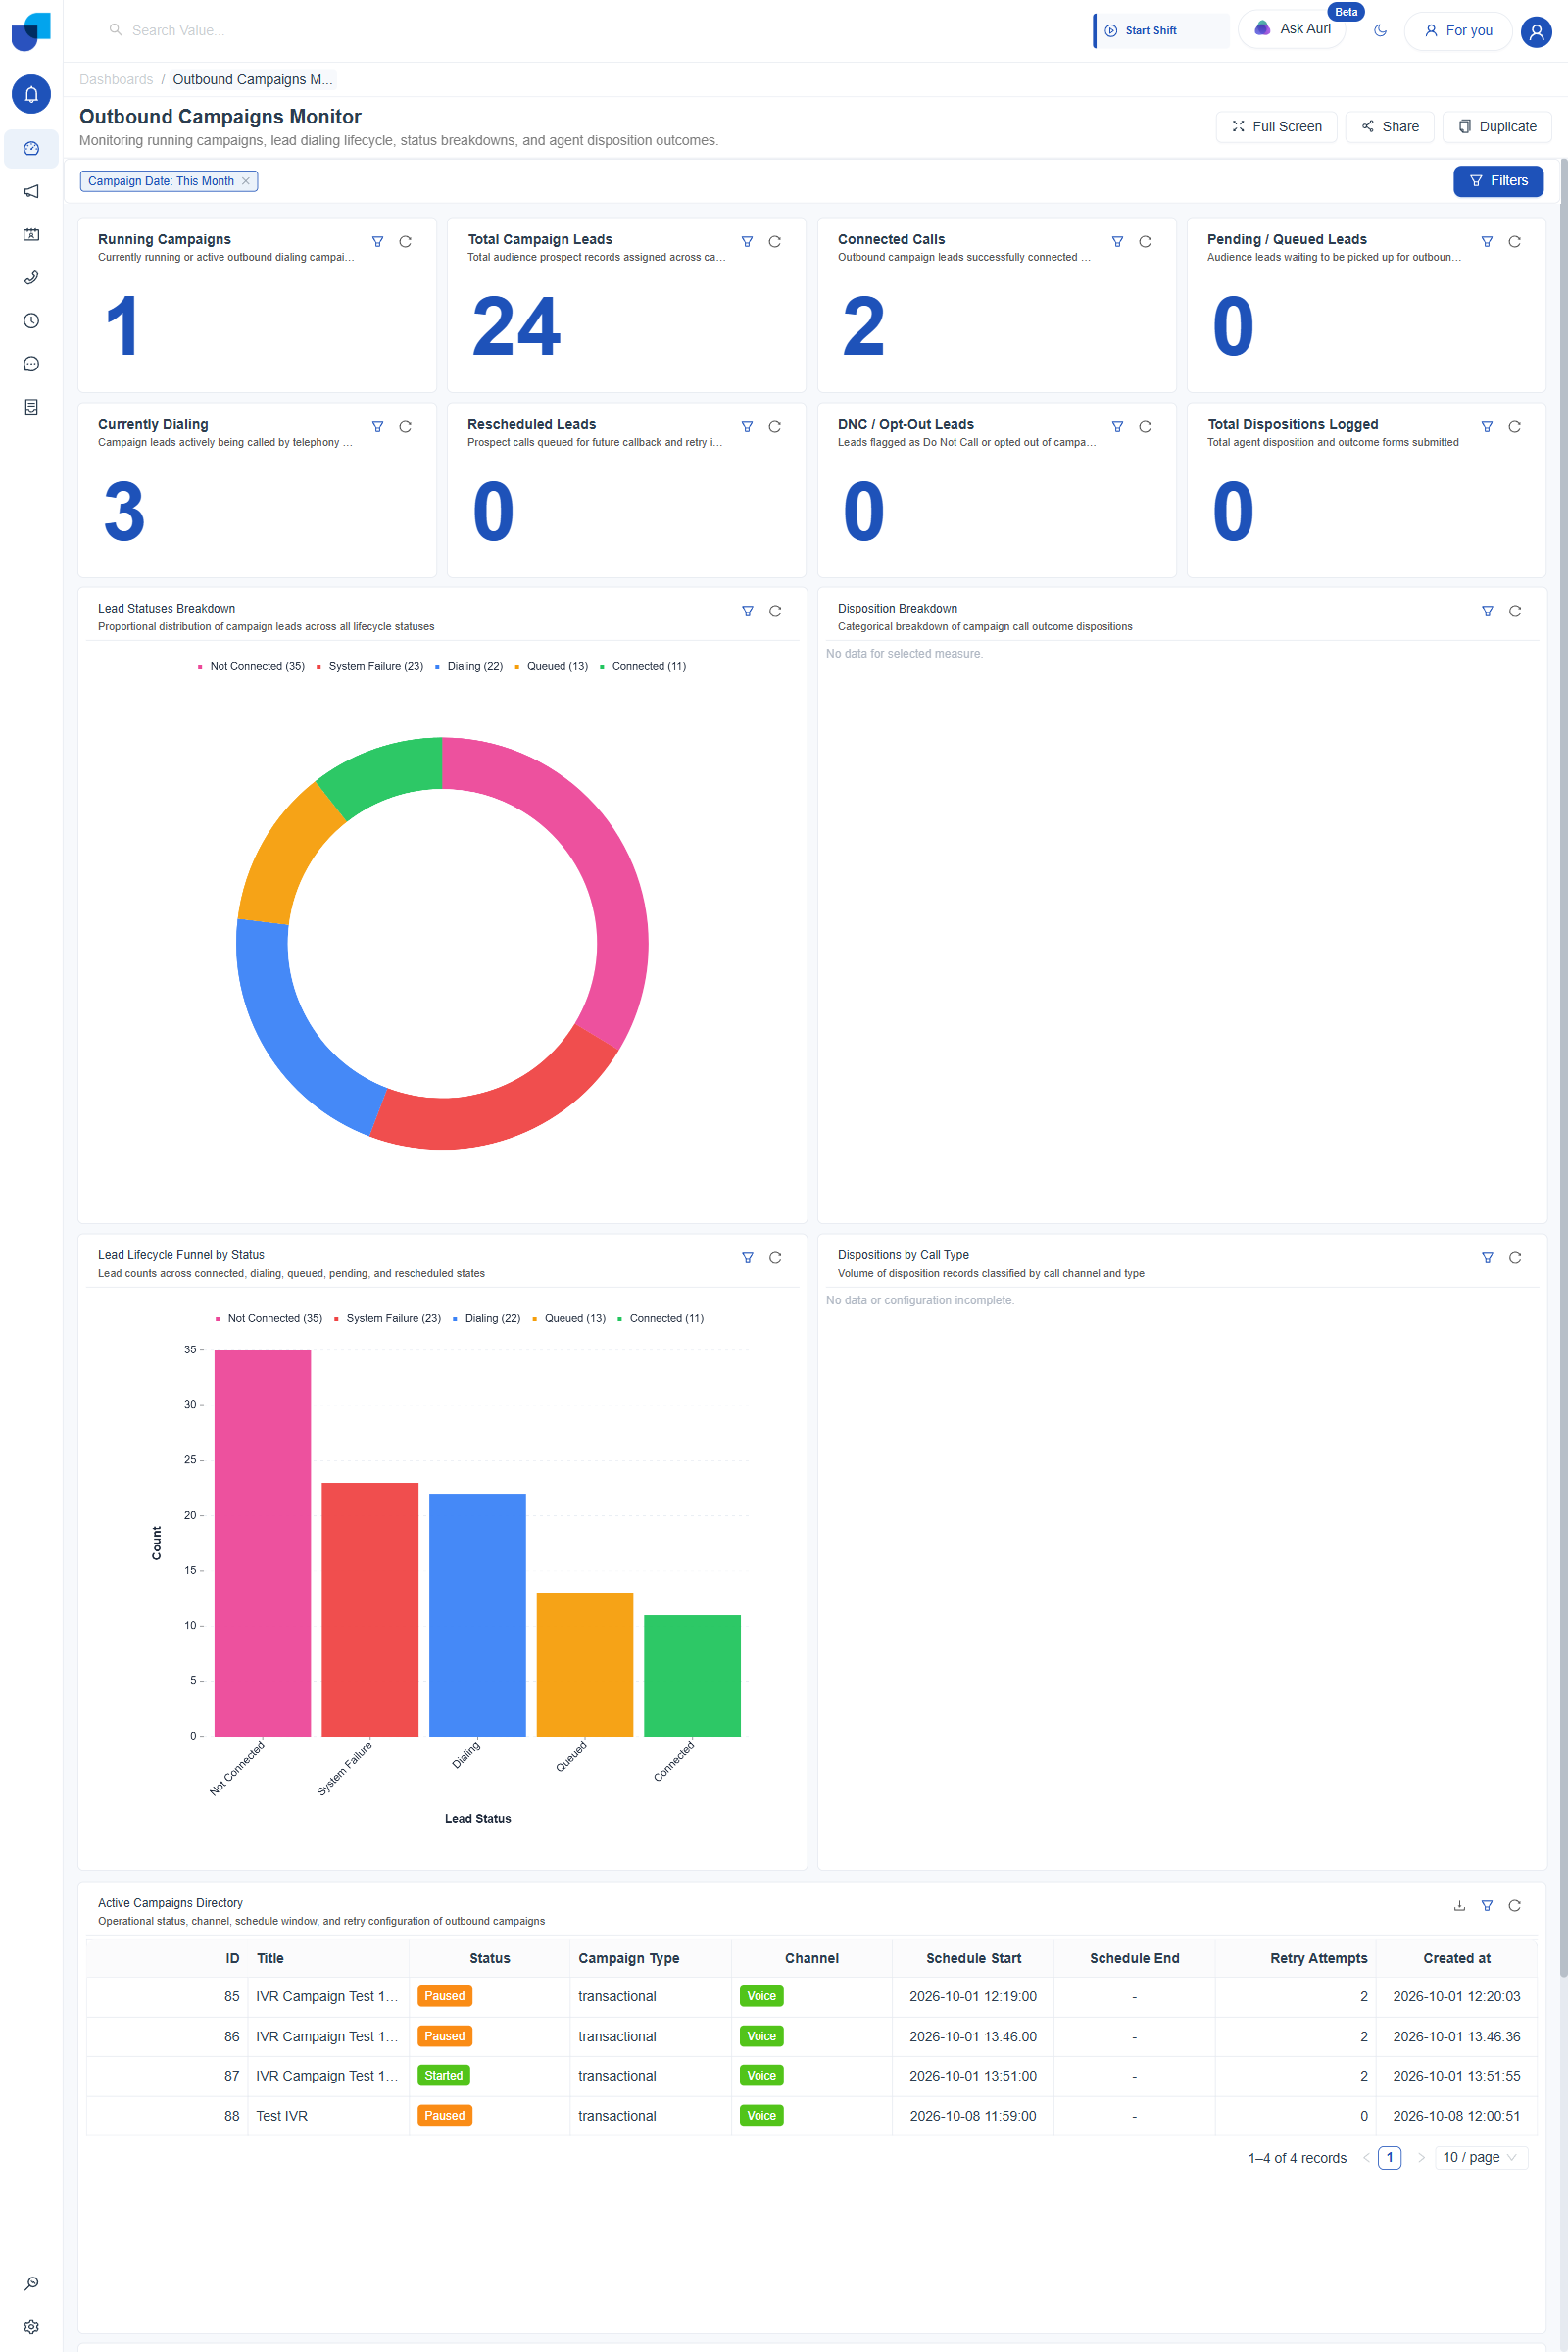
Figure 4. Outbound Campaigns Monitor: thirteen widgets in total, eight Stat tiles, four charts, and an Active Campaigns Directory table.
| Widget | Type | Logic | Shows |
|---|---|---|---|
| Running Campaigns | Stat | Count measure on the Campaign module, filtered to running or active status. | Currently running or active outbound dialing campaigns. |
| Total Campaign Leads | Stat | Count measure on the Campaign Leads module, filtered to this month's Campaign Date. | Total audience prospect records assigned across campaigns. |
| Connected Calls | Stat | Count measure on the Campaign Leads module, filtered to a connected outcome. | Outbound campaign leads successfully connected with an agent. |
| Pending / Queued Leads | Stat | Count measure on the Campaign Leads module, filtered to pending or queued status. | Audience leads waiting to be picked up for outbound dialing. |
| Currently Dialing | Stat | Count measure on the Campaign Leads module, filtered to leads actively being dialed. | Campaign leads actively being called by the telephony dialer. |
| Rescheduled Leads | Stat | Count measure on the Campaign Leads module, filtered to rescheduled status. | Prospect calls queued for future callback and retry intervals. |
| DNC / Opt-Out Leads | Stat | Count measure on the Campaign Leads module, filtered to Do Not Call or opted out leads. | Leads flagged as Do Not Call or opted out of campaigns. |
| Total Dispositions Logged | Stat | Count measure on the Disposition module. | Total agent disposition and outcome forms submitted. |
| Lead Statuses Breakdown | Donut chart | Count measure on the Campaign Leads module, grouped by the lifecycle Status dimension. | Proportional distribution of campaign leads across all lifecycle statuses: Not Connected, System Failure, Dialing, Queued, and Connected. |
| Disposition Breakdown | Chart | Count measure on the Disposition module, grouped by outcome. | Categorical breakdown of campaign call outcome dispositions. No data for selected measure. |
| Lead Lifecycle Funnel by Status | Column chart | The same Count measure and Status grouping as Lead Statuses Breakdown, rendered as a column chart instead of a donut. | Lead counts across connected, dialing, queued, pending, and rescheduled states. |
| Dispositions by Call Type | Chart | Count measure on the Disposition module, grouped by call channel and type. | Volume of disposition records classified by call channel and type. No data or configuration incomplete. |
| Active Campaigns Directory | Table | Raw Campaign rows, with ID, Title, Status, Campaign Type, Channel, Schedule Start, Schedule End, Retry Attempts, and Created at dragged onto Columns. | Operational status, channel, schedule window, and retry configuration of outbound campaigns. Four real campaign rows, color coded by Status (Paused, Started) and Channel (Voice). |
Inbound Live & Queue Monitor and Outbound Campaigns Monitor both carry a default global filter, Call Date: Today and Campaign Date: This Month, shown as a removable chip right under the title, with a Filters button to change it. This is the global Filter Group described in Filters, pre-configured by whoever built the dashboard and visible to every viewer.