Getting Started
Dashboards and Reports sit side by side in the left rail, each backed by the same underlying Builder. This page covers where to find both, what a role needs before it can build, and the shortest real path from an empty canvas to a first live widget.
Where to Find It
- In the left rail, open Dashboards, shown with a grid style icon, for ongoing monitoring canvases. Open Reports, shown with a document icon, for exportable, single purpose views.
- Both land on a searchable, paginated card grid of existing items. Each card shows an icon, a title, a one line description, the owner's initials, and a small set of status icons.
- A Create button sits in the top right corner of both list pages, next to the search box.
- The left side of each page also carries its own secondary navigation, listing recently viewed dashboards or reports so you can jump between a handful of frequently used ones without going back to the main grid.
Figure 1. The Dashboards list. Create button top right, search box, and a card grid of existing dashboards.
Built-in Starter Content
Both list pages ship with pre-built items alongside anything your organization has created. These seeded items, for example CRM Executive & Support Overview and My Workspace (Agent Desk) among dashboards, or Lead Detail Report and Campaign Summary among reports, show System User as their owner on the card, in place of a real person's name and initials.
Figure 2. CRM Executive & Support Overview, a seeded dashboard: Full Screen, Share, and Duplicate are available, but there is no Edit button.
A seeded item's consumer view behaves differently from one you build yourself. For dashboards the pattern is consistent: all four seeded dashboards, profiled individually in Built-in Dashboards, carry Full Screen, Share, and Duplicate, with no Edit button. For reports it is not consistent: across the twelve seeded reports in Built-in Reports, eight carry only Download PDF and Duplicate and four add Share, with no Edit button on any of them. Ownership by System User is a strong hint that an item is reference content, not a reliable predictor of exactly which buttons it will show.
| Owner | Dashboard Consumer View | Report Consumer View |
|---|---|---|
| You, or another named user | Full Screen, Share, Duplicate, Edit | Download PDF, Share, Duplicate, Edit |
System User | Full Screen, Share, Duplicate. No Edit on any of the four seeded dashboards. | Varies by report. Eight carry only Download PDF and Duplicate, four add Share, and none shows Edit. See Built-in Reports. |
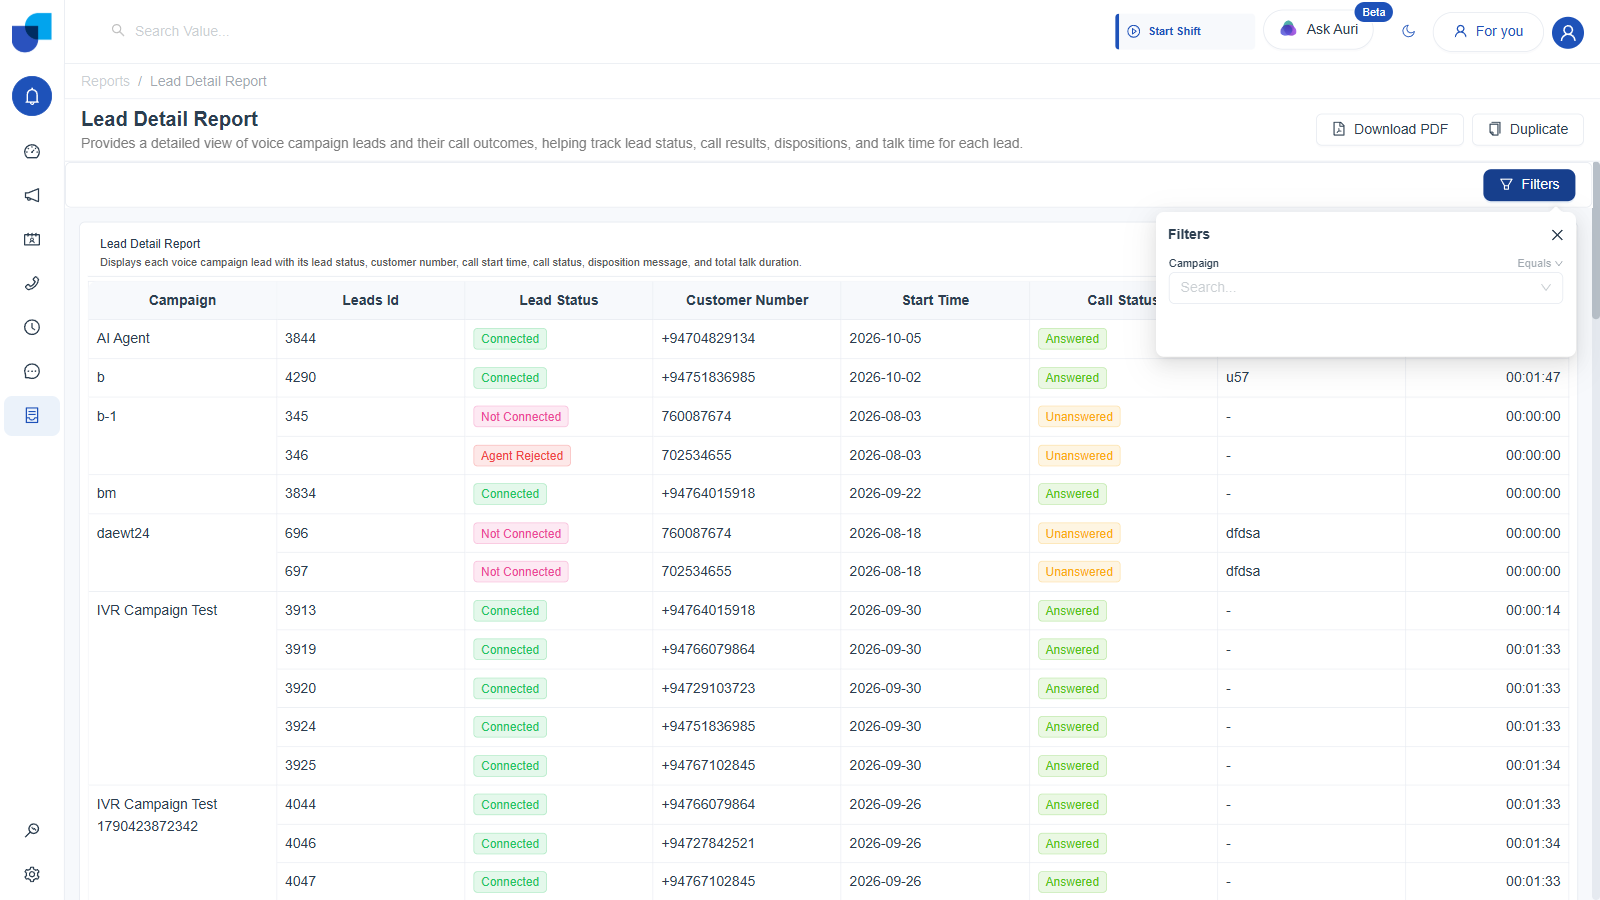
Figure 3. Lead Detail Report, a seeded report: only Download PDF and Duplicate remain, plus a Filters button that opens a live filter control for viewers.
That Filters button is the same global Filter Group documented under Filters, rendered for a viewer who cannot enter the Builder. On Lead Detail Report it surfaced a single Campaign, Equals, filter with a search dropdown, so the global Filter Group reaches the consumer view, not just the Builder's own Preview tab.
Seeded items are reference examples, not templates you edit in place. To build on one, click Duplicate. The copy is a fully independent item owned by you, with Edit available, exactly as described in Sharing, Duplicating & Publishing Dashboards.
What You Need Before You Start
| Requirement | Detail |
|---|---|
| Permission | Your role needs Reports Configuration, Configure Reports set to Yes. See the Permissions page for exactly where this lives in Role Manager. |
| A question to answer | The builder starts from a completely empty canvas. Decide what you are tracking before opening it. See Use Case Scenario for a worked example built around a real support team's SLA tracking need. |
| Nothing else | There is no separate data connection step. Every CRM module, plus Telephony, Campaign, Conversations, Workflow, and Workforce Monitor, is already available in the Fields panel the moment you open the builder. |
Fastest Path to a First Widget
- Click Create. Give the new item a Title and a Description, both required, and optionally pick an Icon from the searchable icon combobox.
- Saving takes you straight into the Builder, at
/dashboards/{id}/builderfor a dashboard or/reports/{id}/builderfor a report, opened on the Build tab. - In the right hand WIDGETS panel, click a widget type. Table is the simplest place to start, since it has no particular chart shape to satisfy.
- In the left FIELDS panel, expand a module, for example Service Cases, and drag a dimension field into the widget's Columns drop zone. The widget renders live, real data immediately. There is no separate run query step anywhere in this builder.
- Click Save, then click Publish when you want the item visible outside the builder as well.
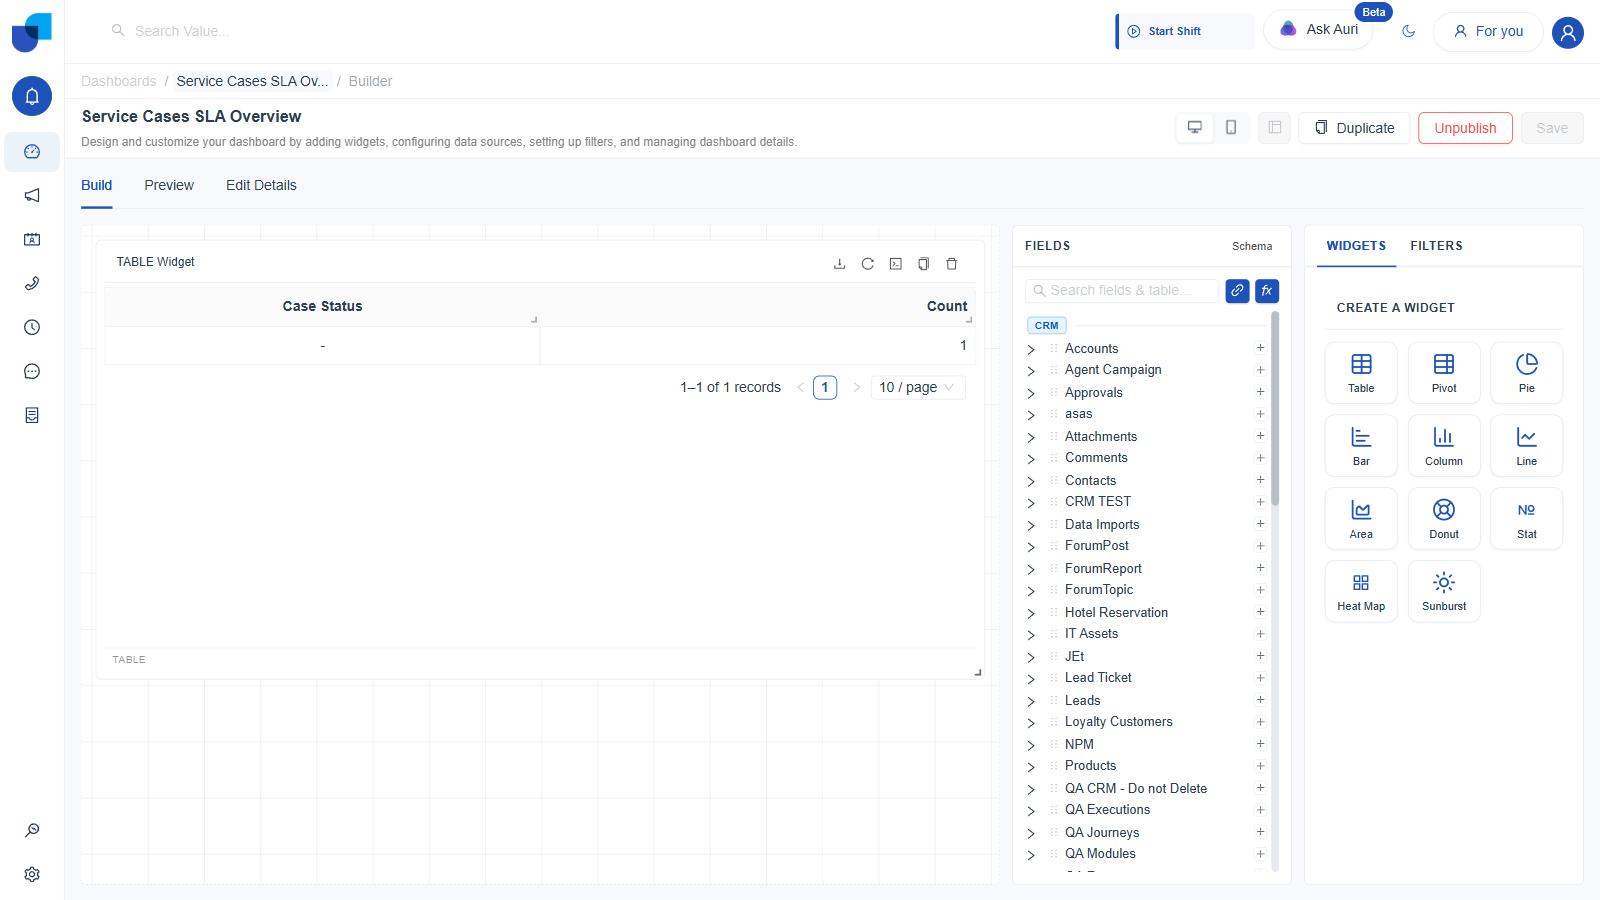
Figure 4. The Builder's Build tab, shown here on an example dashboard built for this documentation, not one of the four seeded ones. Seeded dashboards carry no Edit access, so this is the only way to show this layout with a real, already-built widget on the canvas. Canvas in the center, FIELDS panel on the left, WIDGETS and FILTERS tabs on the right.
Dashboards and Reports share the exact same Builder component. Everything documented under Widget Builder in this section, including the Fields panel, the Schema diagram, joins, calculated fields, all eleven widget types, and filters, applies equally whether you opened it from /dashboards or from /reports.
Reading the Builder's Layout
Once inside the Builder, three tabs sit just under the page title: Build, Preview, and Edit Details. Build is where you add and configure widgets, exactly as described above. Preview renders the dashboard or report the way an end user would see it, without leaving the Builder. Edit Details holds the item's Title, Description, and Icon again, plus a Visibility Controls toggle, Hidden versus Published, and, at the very bottom, a Delete action.
The header above those tabs carries the main action buttons: a Layout device switch, Desktop or Phone, dashboards only, a widget arrange button that stays disabled until the canvas has at least two widgets, Duplicate, Publish, which flips to Unpublish once clicked, and Save.
Save and Publish are two separate actions. Clicking Publish changes the item's visibility state in memory, but you still need to click Save afterward for that change to persist.
Where This Fits
For a full, item by item profile of every seeded dashboard and report, including their widgets and their filters, see Built-in Dashboards and Built-in Reports. For the full widget by widget walkthrough of building a dashboard or a report from scratch, continue to Creating a Dashboard or Creating a Report. For how fields, joins, calculated fields, and filters actually work underneath the widgets you drop onto the canvas, jump straight to Widget Builder.