Built-in Reports
These are the twelve built-in reports that ship with Uniconnect AI. Most are owned by System User, a system account, rather than a real person.
- Lead Detail Report
- Campaign Summary
- Support Tickets Overview & SLA Intelligence
- Sales Leads & Pipeline Conversion Report
- Accounts Directory & Portfolio Intelligence
- Outbound Report
- Call Distribution
- Abandoned Calls
- Queue Statistics
- Activity Summary
- Activity Report
- Login History
Reports fall into two groups. Seven render immediately on open: Lead Detail Report, Campaign Summary, Support Tickets Overview & SLA Intelligence, Sales Leads & Pipeline Conversion Report, Accounts Directory & Portfolio Intelligence, Outbound Report, and Call Distribution. Five sit behind a mandatory Filters card and only render after Generate Report is clicked: Abandoned Calls, Queue Statistics, Activity Summary, Activity Report, and Login History. All five of the gated reports pre-fill a sensible default date range, so Generate Report can be clicked immediately without changing anything.
Lead Detail Report
Lead Detail Report is a single wide table that lists every voice campaign lead captured in the platform, one row per lead rather than one row per campaign. Each row carries the originating campaign name, a lead ID, the lead's connection status, Connected, Not Connected, or Agent Rejected, the customer's phone number, and the call's start time. Three further columns record the call status, Answered or Unanswered, a free text disposition message left by whoever handled the lead, and the total talk duration for that call. A Campaign filter sits behind the Filters button, but it is not mandatory to generate output: opening the report with no filter applied already renders every lead across every campaign, and the Campaign field only narrows that set down to one campaign when used. A Start Time (Row) granularity selector in the table's own toolbar, currently set to Day, lets the grouping of that date column be changed without touching the Filters panel at all.
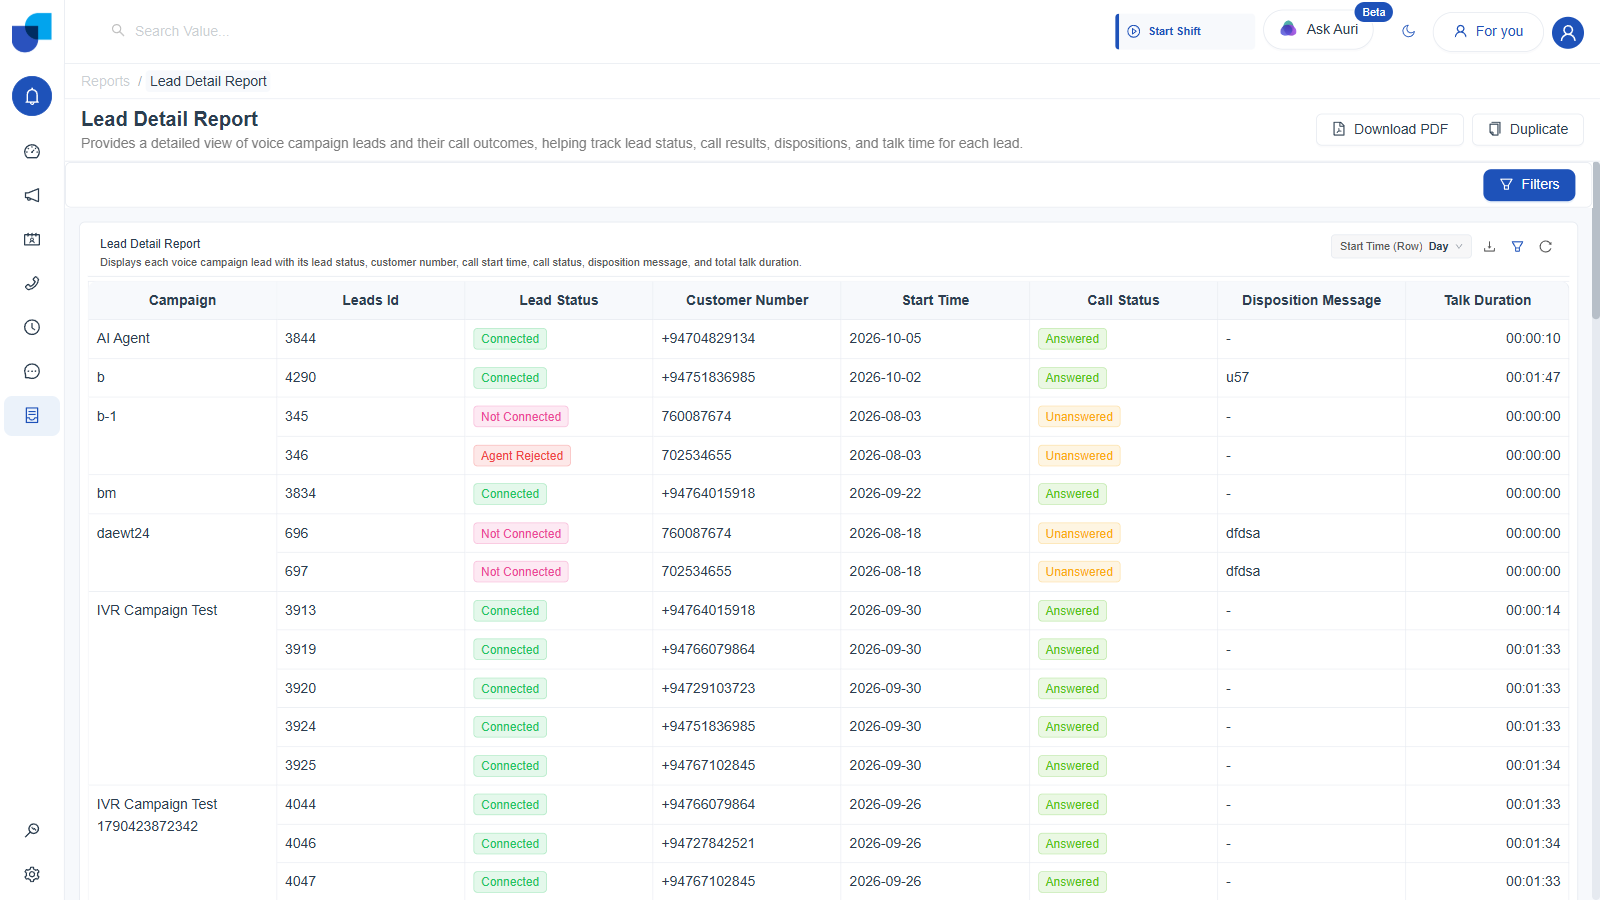
Figure 1. Lead Detail Report: every voice campaign lead, across every campaign, with no filter required.
| Widget | Type | Logic | Columns |
|---|---|---|---|
| Lead Detail Report | Table | Raw Lead rows from the Campaign Leads module, one row per lead, optionally narrowed by the Campaign filter. No aggregation. | Campaign, Leads Id, Lead Status, Customer Number, Start Time, Call Status, Disposition Message, Talk Duration. |
Campaign Summary
Campaign Summary is a single wide pivot table that compares every campaign side by side. Each row is one campaign, identified by its Title and its Dialing Mode, for example Power, Preview, or ai_agent. The columns are split into two top level groups. Calls breaks call activity down by call status: Abandoned, Agent Rejected, Answered, Cancelled, Dialing, DNC, Failed, On Hold, Preview, Queue Waiting, Ringing, Talking, Unanswered, and Voicemail. Leads breaks lead activity down by lead status: Agent Rejected, Archived, Cancelled, Connected, Delivered, Delivery Failed, Dialing, DNC, Not Connected, Pending, Preview, Queue Dropped, Queued, Rescheduled, Sent, System Failure, and Waiting in Call Queue. Beneath each status sits a further numeric grouping level, 0, 2, 3, 4, and 10, and under each of those the table reports three measures: Calls Count, Total Talk Duration, and Total Hold Duration. A cell shows a dash wherever a campaign has no activity for that combination. A Campaign filter sits behind the Filters button, with an Equals operator and a searchable value list, and it narrows the table to one campaign. The widget's own header carries a Download Excel icon and a Refresh icon. The report's description reads "Campaign Summary Report". Its header offers Download PDF, Share, and Duplicate, and no Edit button.
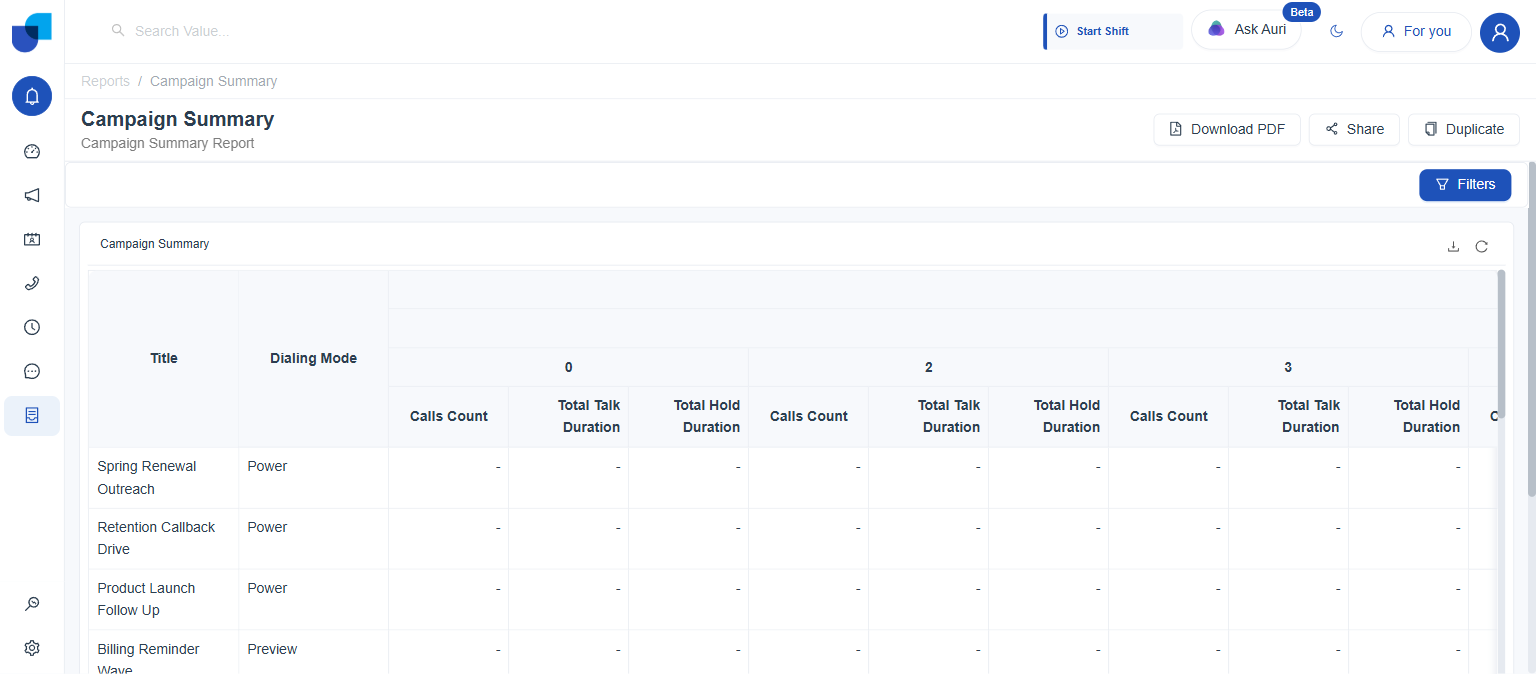
Figure 2. Campaign Summary: one row per campaign, with Calls Count, Total Talk Duration, and Total Hold Duration measures across the status columns.
| Widget | Type | Logic | Columns |
|---|---|---|---|
| Campaign Summary | Pivot table | One row per campaign, optionally narrowed by the Campaign filter. Call and lead counts and durations are grouped by status. | Title, Dialing Mode, then Calls and Leads status groups, each with Calls Count, Total Talk Duration, and Total Hold Duration. |
Support Tickets Overview & SLA Intelligence
Support Tickets Overview & SLA Intelligence is the richest of the twelve built-in reports, assembled from six separate widgets rather than a single table. Four Stat tiles across the top read Total Tickets, Active Open Tickets, High & Urgent Priority, and Closed & Resolved directly off the Support Ticket module, giving 1,019, 689, 683, and 330 respectively. Two column charts beneath them, Tickets by Lifecycle Status and Tickets by Urgency Tier, break that same 1,019 ticket population down by Status (Open, In Progress, Closed, New) and by Priority (High, Low, Medium). A Status × Priority Cross-Tabulation Matrix renders the two dimensions against each other in one grid with row and column totals, and a final Support Tickets Master Registry table lists the underlying tickets themselves: ID, Subject, Status, Priority, Description, Contact, Organization, Assigned user, Created At, and Updated At. No mandatory filter gate sits in front of this report, it renders immediately on open.
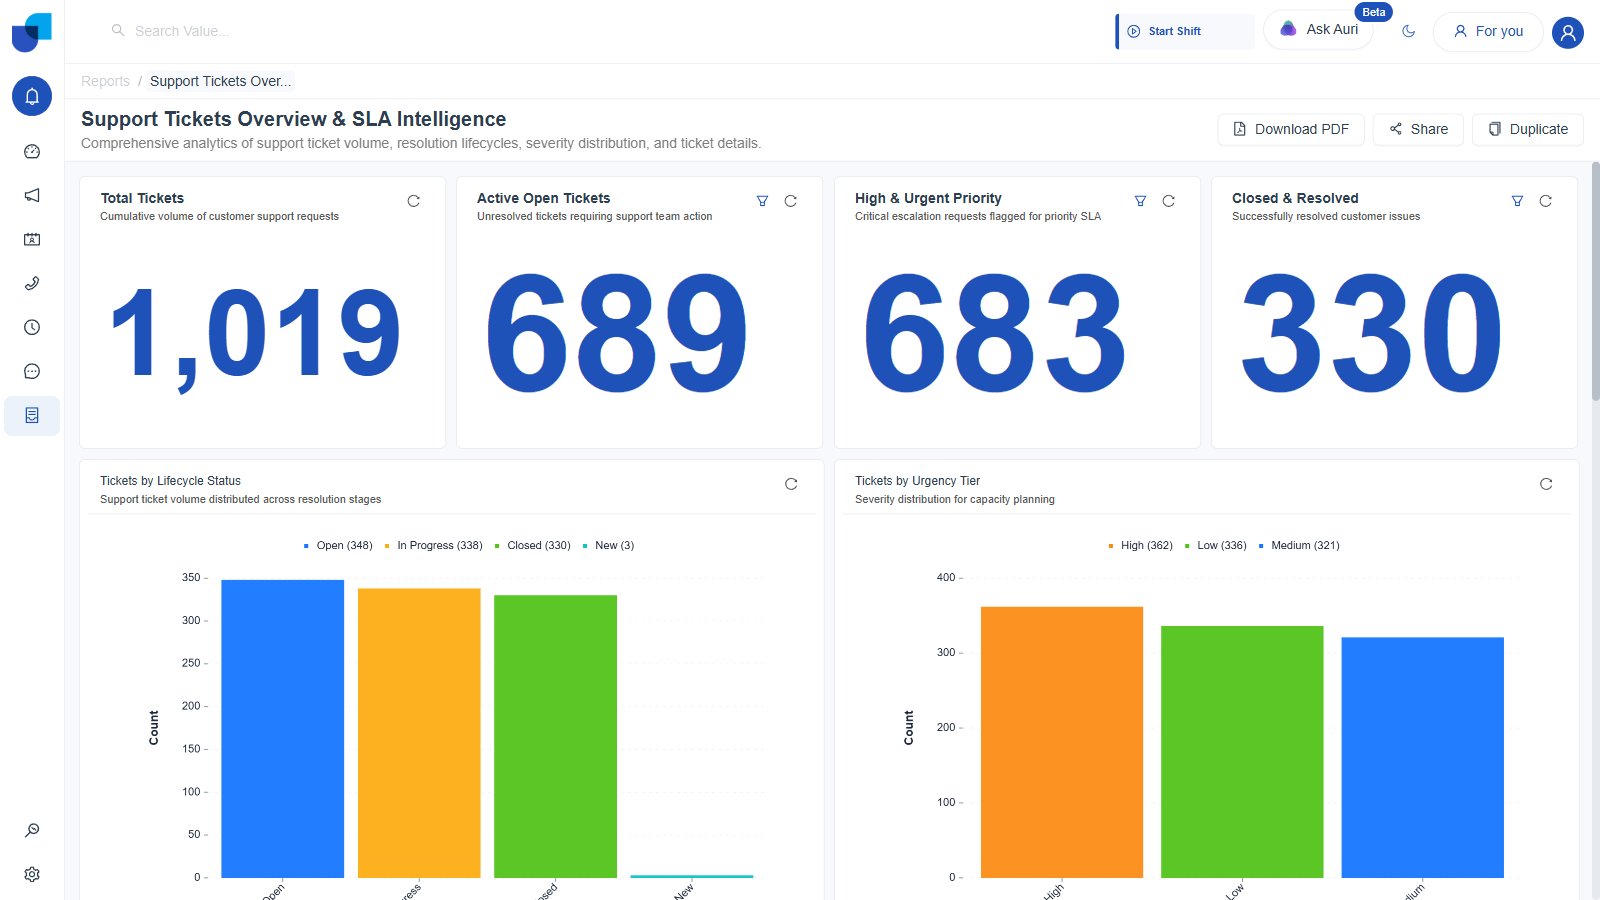
Figure 3. Support Tickets Overview & SLA Intelligence: four Stat tiles and two charts.
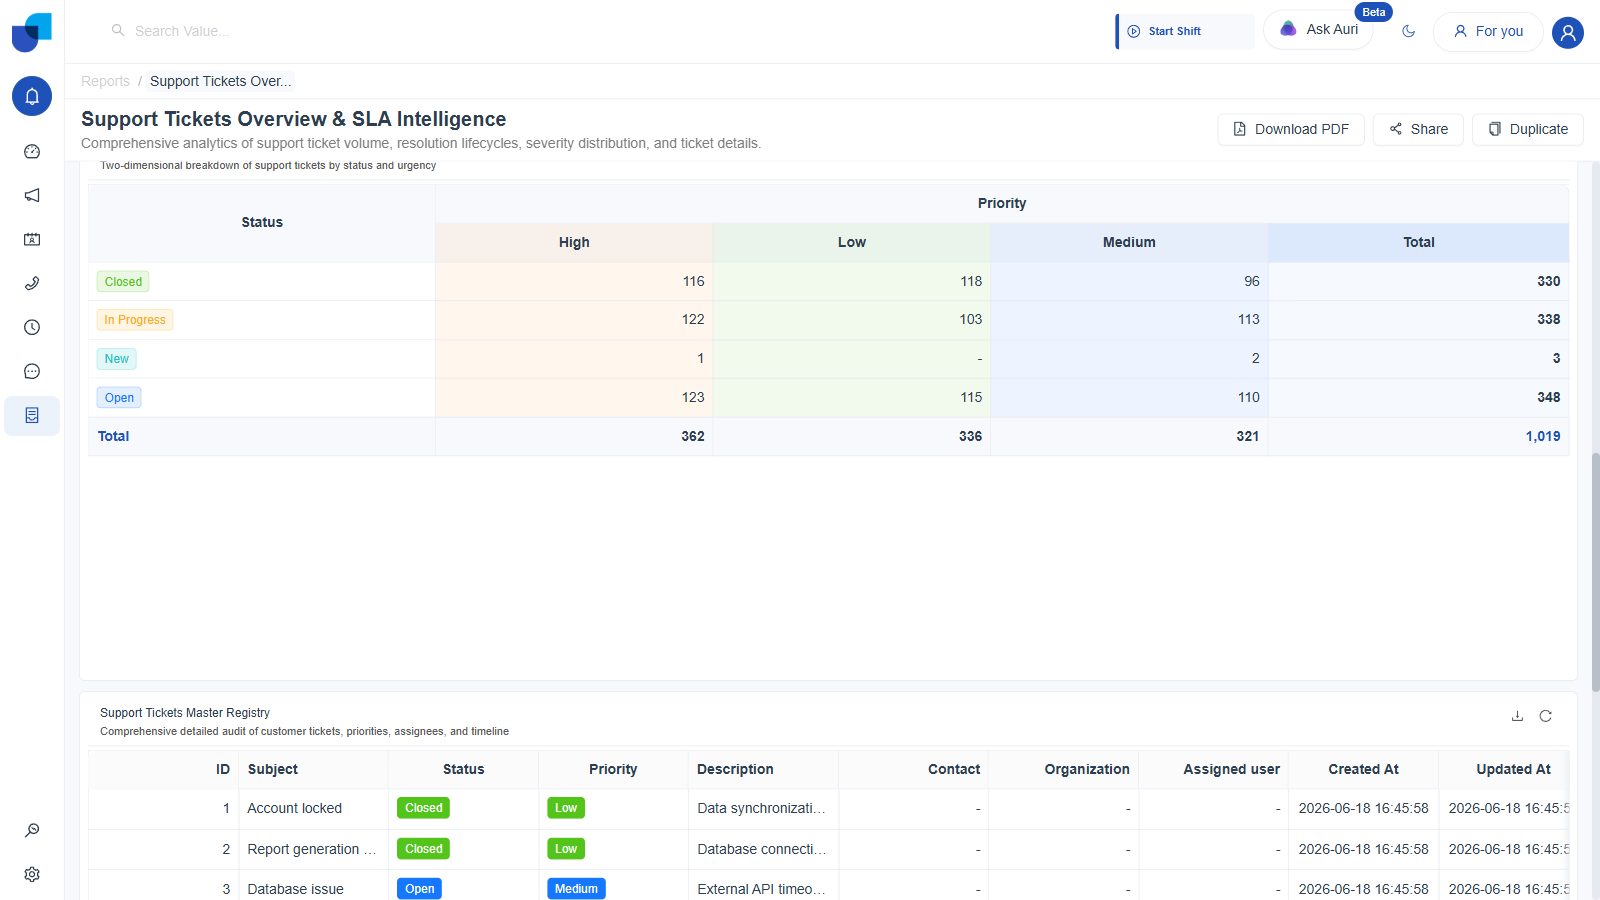
Figure 4. Scrolled further: the Status × Priority Cross-Tabulation Matrix and the Support Tickets Master Registry table.
| Widget | Type | Logic | Shows |
|---|---|---|---|
| Total Tickets | Stat | Count measure on the Support Ticket module, no filter applied. | Cumulative volume of customer support requests. Reading 1,019. |
| Active Open Tickets | Stat | Count measure on the Support Ticket module, filtered to open and unresolved statuses. | Unresolved tickets requiring support team action. Reading 689. |
| High & Urgent Priority | Stat | Count measure on the Support Ticket module, filtered to High and Urgent priority. | Critical escalation requests flagged for priority SLA. Reading 683. |
| Closed & Resolved | Stat | Count measure on the Support Ticket module, filtered to Closed and Resolved status. | Successfully resolved customer issues. Reading 330. |
| Tickets by Lifecycle Status | Column chart | Count measure on the Support Ticket module, grouped by the Status dimension. | Open 348, In Progress 338, Closed 330, New 3. |
| Tickets by Urgency Tier | Column chart | Count measure on the Support Ticket module, grouped by the Priority dimension. | High 362, Low 336, Medium 321. |
| Status × Priority Cross-Tabulation Matrix | Table | Count measure on the Support Ticket module, pivoted with Status as rows and Priority as columns, with row and column totals. | Two dimensional breakdown of all 1,019 tickets by Status and Priority, with row and column totals. |
| Support Tickets Master Registry | Table | Raw Support Ticket rows, no aggregation. | ID, Subject, Status, Priority, Description, Contact, Organization, Assigned user, Created At, Updated At. |
Sales Leads & Pipeline Conversion Report
Sales Leads & Pipeline Conversion Report gives an executive view of the sales funnel, built from the Leads module rather than Support Ticket. Four Stat tiles, Total Leads, Active Pipeline Leads, Qualified Opportunities, and New Inquiries, read 6, 5, 1, and 3 respectively against the current lead population. A Leads Across Pipeline Conversion Gates column chart breaks that same population down by its four pipeline stages, New, Closed Lost, Qualified, and Closed Won, each currently holding a handful of leads. The Sales Leads Comprehensive Directory table underneath lists every individual lead by ID, First Name, Last Name, Associated Account, Pipeline Stage, Phone Number, Created At, and Updated At, six rows in total. Like Support Tickets Overview, it renders immediately with no mandatory filter gate.
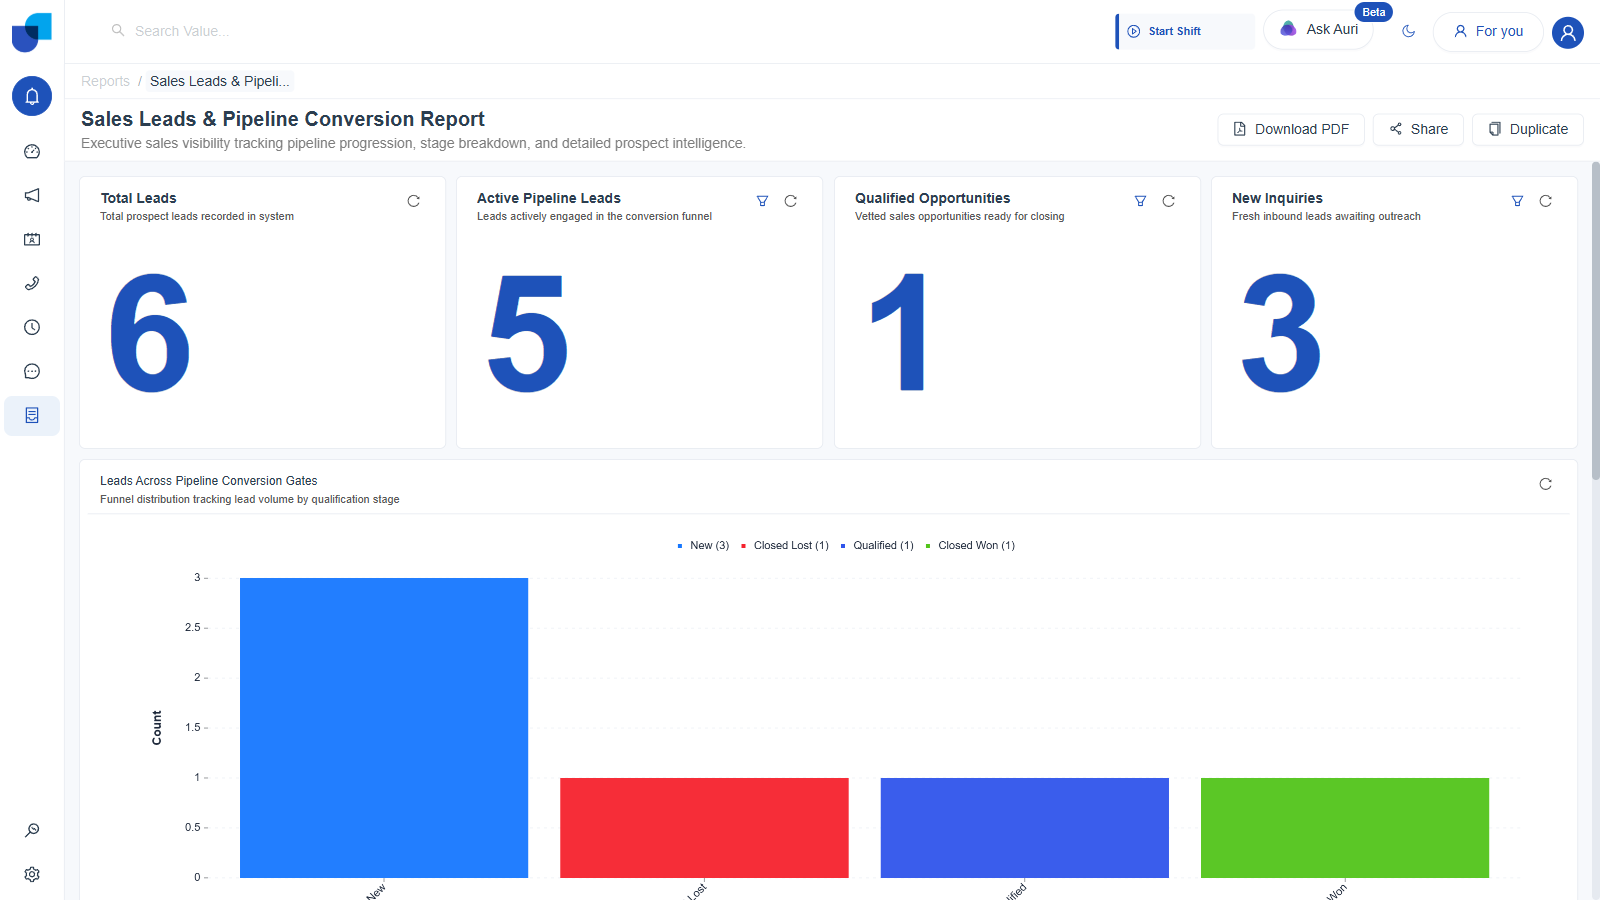
Figure 5. Sales Leads & Pipeline Conversion Report: four Stat tiles and the pipeline funnel chart.
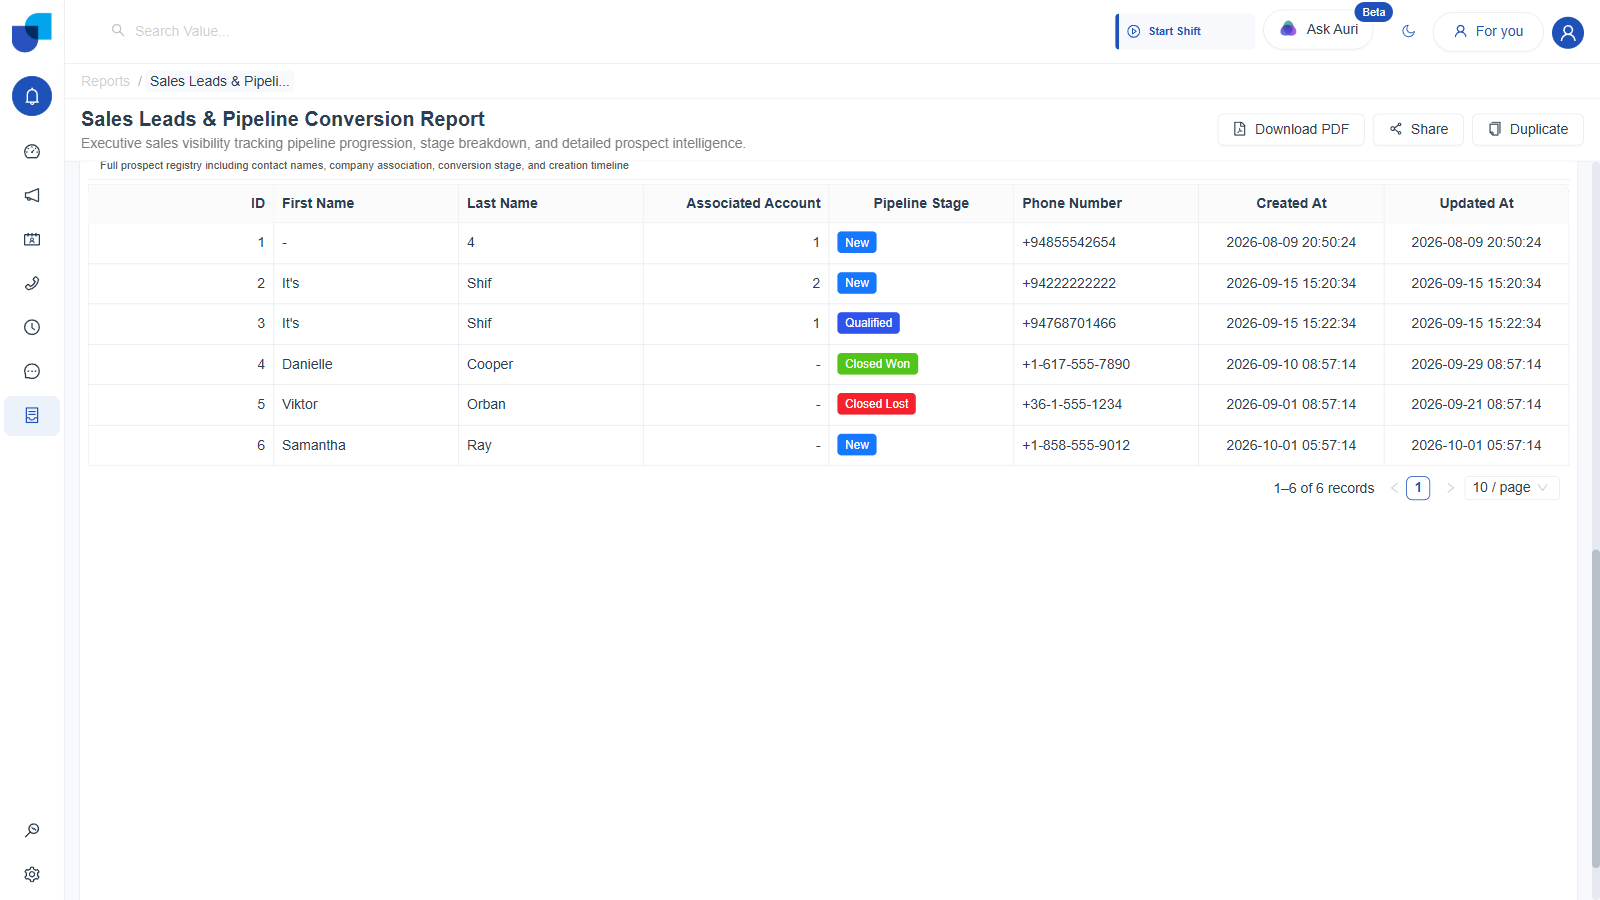
Figure 6. Scrolled further: the six row Sales Leads Comprehensive Directory table.
| Widget | Type | Logic | Shows |
|---|---|---|---|
| Total Leads | Stat | Count measure on the Leads module, no filter applied. | Total prospect leads recorded in system. Reading 6. |
| Active Pipeline Leads | Stat | Count measure on the Leads module, filtered to active pipeline stages. | Leads actively engaged in the conversion funnel. Reading 5. |
| Qualified Opportunities | Stat | Count measure on the Leads module, filtered to the Qualified stage. | Vetted sales opportunities ready for closing. Reading 1. |
| New Inquiries | Stat | Count measure on the Leads module, filtered to the New stage. | Fresh inbound leads awaiting outreach. Reading 3. |
| Leads Across Pipeline Conversion Gates | Column chart | Count measure on the Leads module, grouped by the Pipeline Stage dimension. | New 3, Closed Lost 1, Qualified 1, Closed Won 1. |
| Sales Leads Comprehensive Directory | Table | Raw Leads rows, no aggregation. | ID, First Name, Last Name, Associated Account, Pipeline Stage, Phone Number, Created At, Updated At. Six rows. |
Accounts Directory & Portfolio Intelligence
Accounts Directory & Portfolio Intelligence is the smallest of the richer, multi-widget built-in reports, built around the CRM Accounts module. A single Total Client Accounts Stat tile reads 4, the full count of corporate accounts currently on file. Beside it, an Account Portfolio by Industry column chart breaks that same count down by sector, Manufacturing, Healthcare, Construction, and Telecommunications, one account in each currently. The Enterprise Accounts Comprehensive Register table beneath lists each account by ID, Account Name, Industry, Phone Number, Email, Website, Address, Created At, and Updated At. It renders immediately, with no mandatory filter gate in front of it.
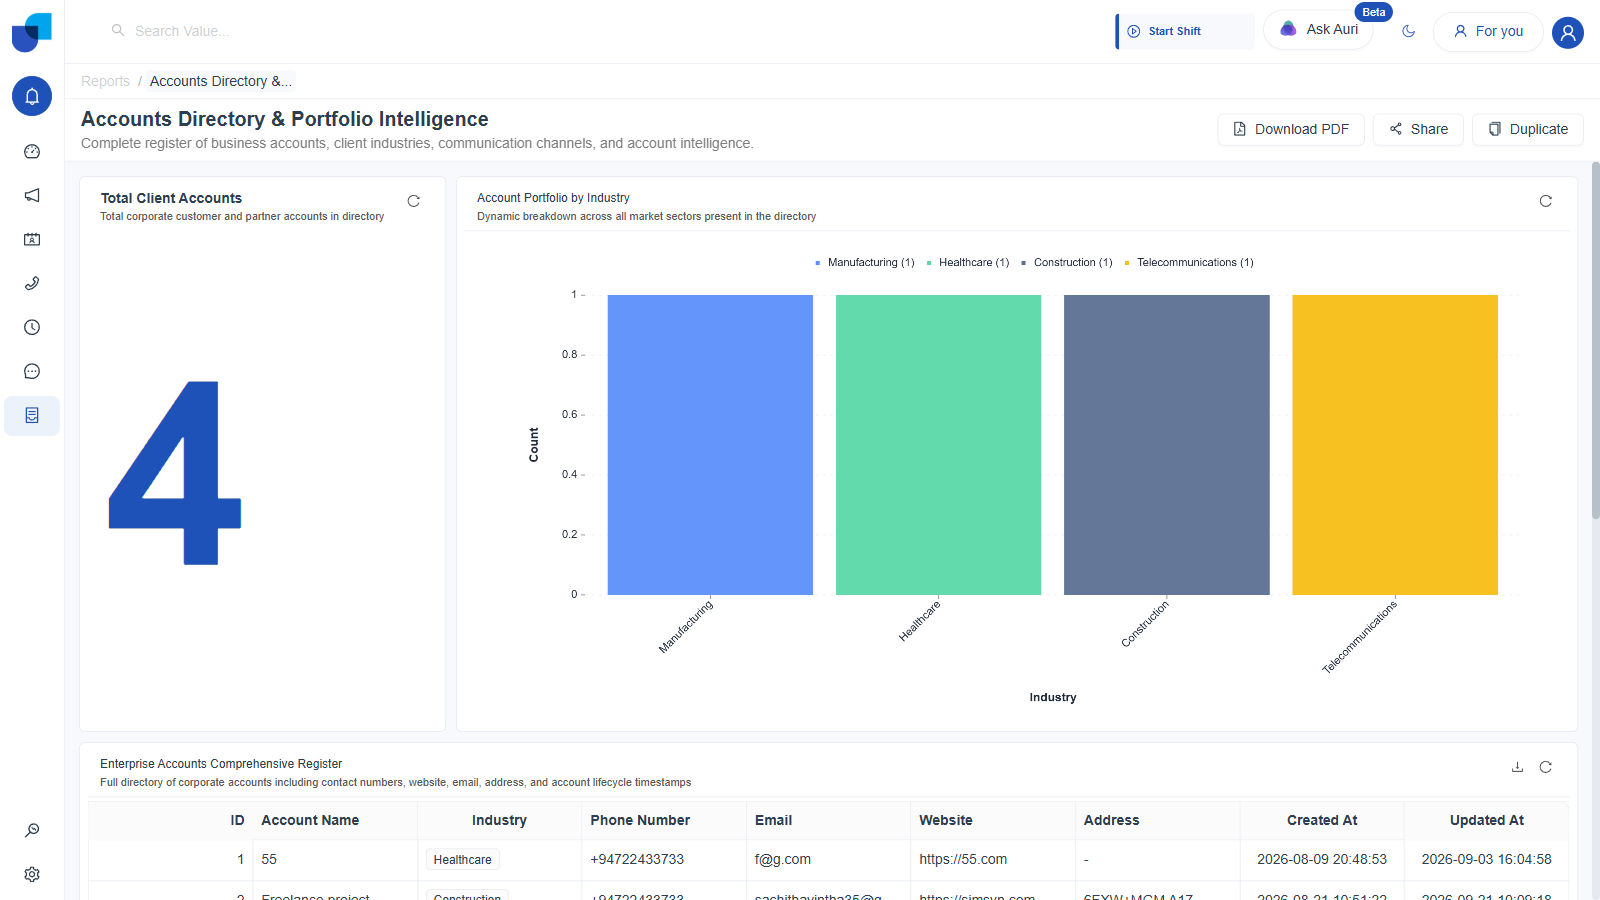
Figure 7. Accounts Directory & Portfolio Intelligence: Total Client Accounts, Account Portfolio by Industry, and the full register.
| Widget | Type | Logic | Shows |
|---|---|---|---|
| Total Client Accounts | Stat | Count measure on the Accounts module, no filter applied. | Total corporate customer and partner accounts in directory. Reading 4. |
| Account Portfolio by Industry | Column chart | Count measure on the Accounts module, grouped by the Industry dimension. | Manufacturing 1, Healthcare 1, Construction 1, Telecommunications 1. |
| Enterprise Accounts Comprehensive Register | Table | Raw Accounts rows, no aggregation. | ID, Account Name, Industry, Phone Number, Email, Website, Address, Created At, Updated At. Four rows. |
Outbound Report
Default filter: Call Time, This Month
Outbound Report is a single pivot table, Outbound Calls by Agent, that breaks daily outbound call outcomes down per agent and extension. Each row is one agent, each pivoted day column splits into Answered and Unanswered sub columns, so a wide date range produces a correspondingly wide table that scrolls horizontally rather than paginating. A default global filter, Call Time: This Month, sits as a removable chip under the title with a Reset to Defaults button beside it, the same global filter chip pattern used on Inbound Live & Queue Monitor and Outbound Campaigns Monitor. A Start Time (Column) granularity selector in the table's own toolbar controls how that pivoted date axis groups, currently by Day. Its own description notes that the report excludes failed dial attempts and calls with no assigned agent.
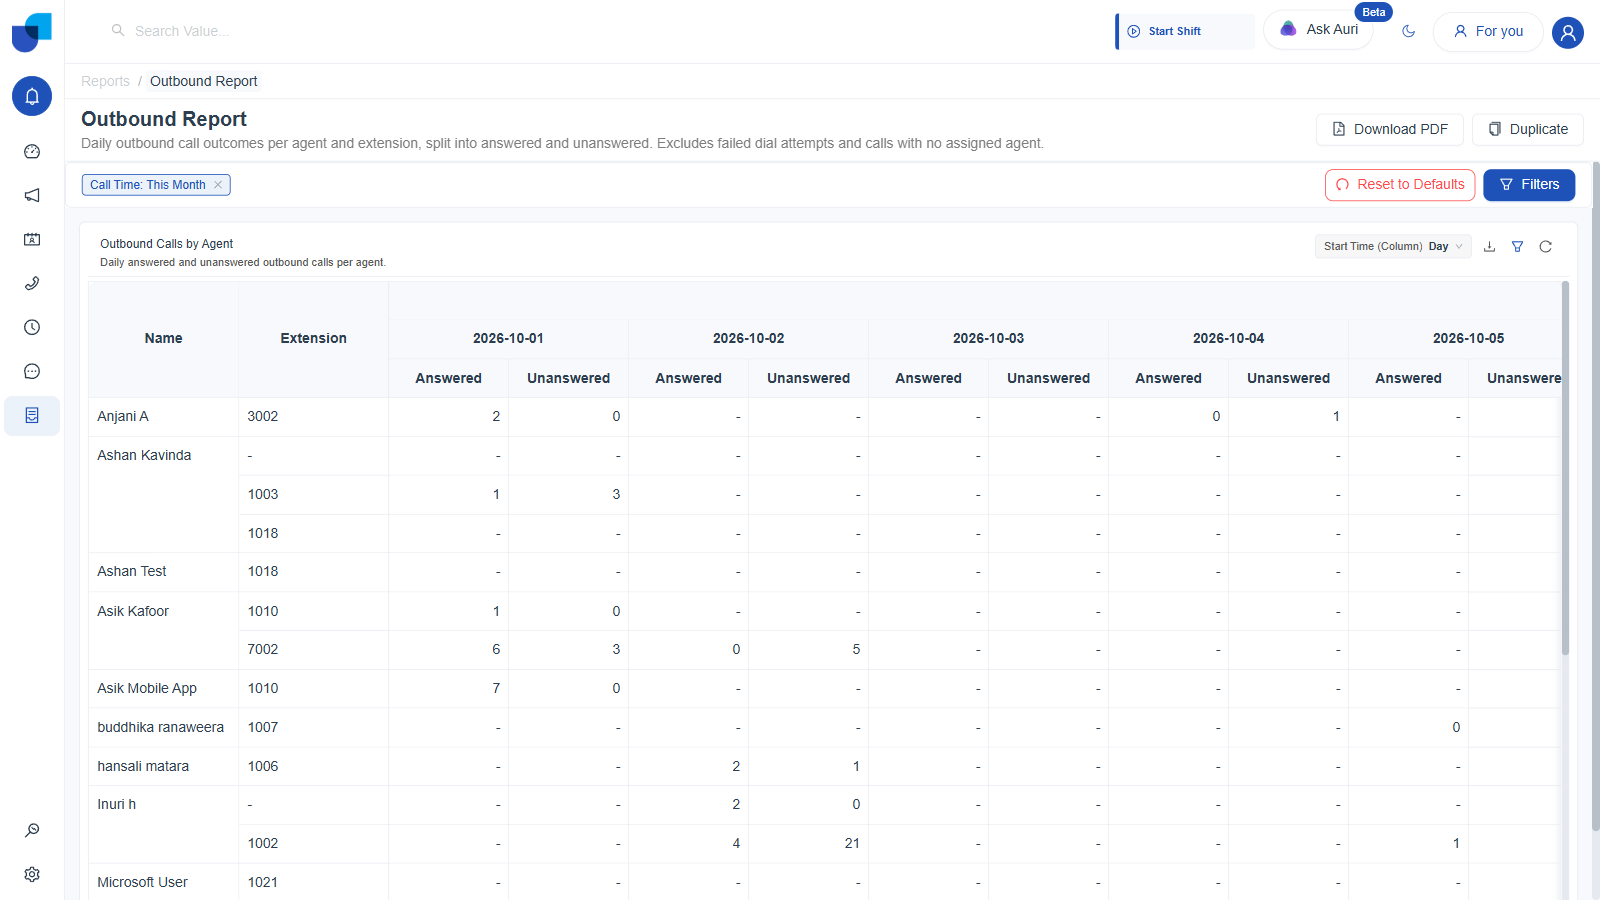
Figure 8. Outbound Report: Outbound Calls by Agent, pivoted by day into Answered and Unanswered columns.
| Widget | Type | Logic | Shows |
|---|---|---|---|
| Outbound Calls by Agent | Pivot table | Answered and Unanswered count measures on the Calls module, filtered to outbound direction, pivoted with Agent/Extension as rows and Start Time (Day) as columns. | Name, Extension rows; Answered and Unanswered sub columns per day. |
Call Distribution
Call Distribution lists one row per day rather than per agent, with Start Time as the row dimension and a wide set of inbound call metrics as columns: Total, Answered, Unanswered, Repeated Call Count, FCR, Service Level, Answered Within SLA, Avg Hold Time, Avg Talk Time, AHT, and Unanswered AHT. It carries no default filter chip, only the Filters button, and renders its full current month of data immediately on open. The FCR and Service Level columns are both percentages, letting day to day service quality be scanned down the table without opening every row individually. A Start Time (Row) granularity selector, set to Day, is the only pivot control exposed on this particular report.
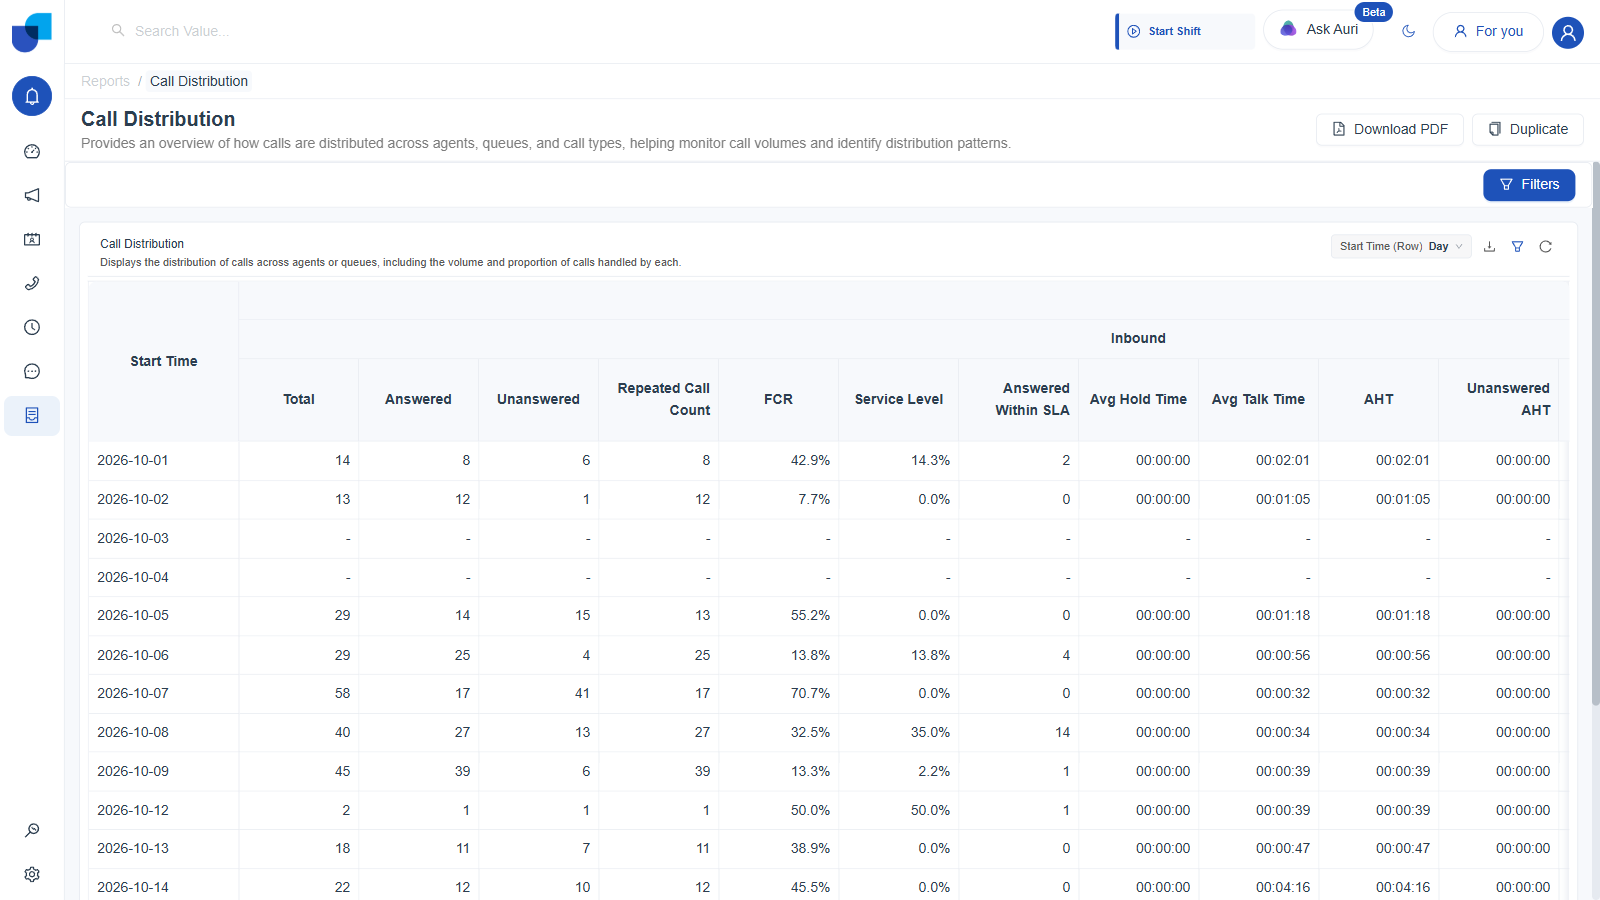
Figure 9. Call Distribution: one row per day, with FCR, Service Level, and hold/talk time metrics.
| Widget | Type | Logic | Shows |
|---|---|---|---|
| Call Distribution | Table | Count and duration measures on the Calls module, grouped by Start Time (Day). FCR and Service Level are calculated percentage measures derived from those same counts. | Start Time, Total, Answered, Unanswered, Repeated Call Count, FCR, Service Level, Answered Within SLA, Avg Hold Time, Avg Talk Time, AHT, Unanswered AHT. |
Abandoned Calls
Mandatory filter: Start Time, defaults to This Month
Abandoned Calls sits behind a mandatory filter gate: opening the report shows a centered Filters card, not the table itself, until Generate Report is clicked. A Start Time range, defaulted to the current month, is required; an optional Groups field narrows the same query down to one queue or extension. Generating with the defaults produces one row per queue group, Groups and Groups Extension on the left, then Total Calls, Answered, Answered (%), Abandoned Calls, and four further columns breaking abandoned calls down by how long the caller waited before hanging up, >= 5 Seconds, >= 10 Seconds, and >= 20 Seconds, each with a raw count and a percentage. Once generated, the same Start Time: This Month chip and Reset to Defaults button appear under the title as on Outbound Report, so the filter can be changed again without reopening the full Filters card.
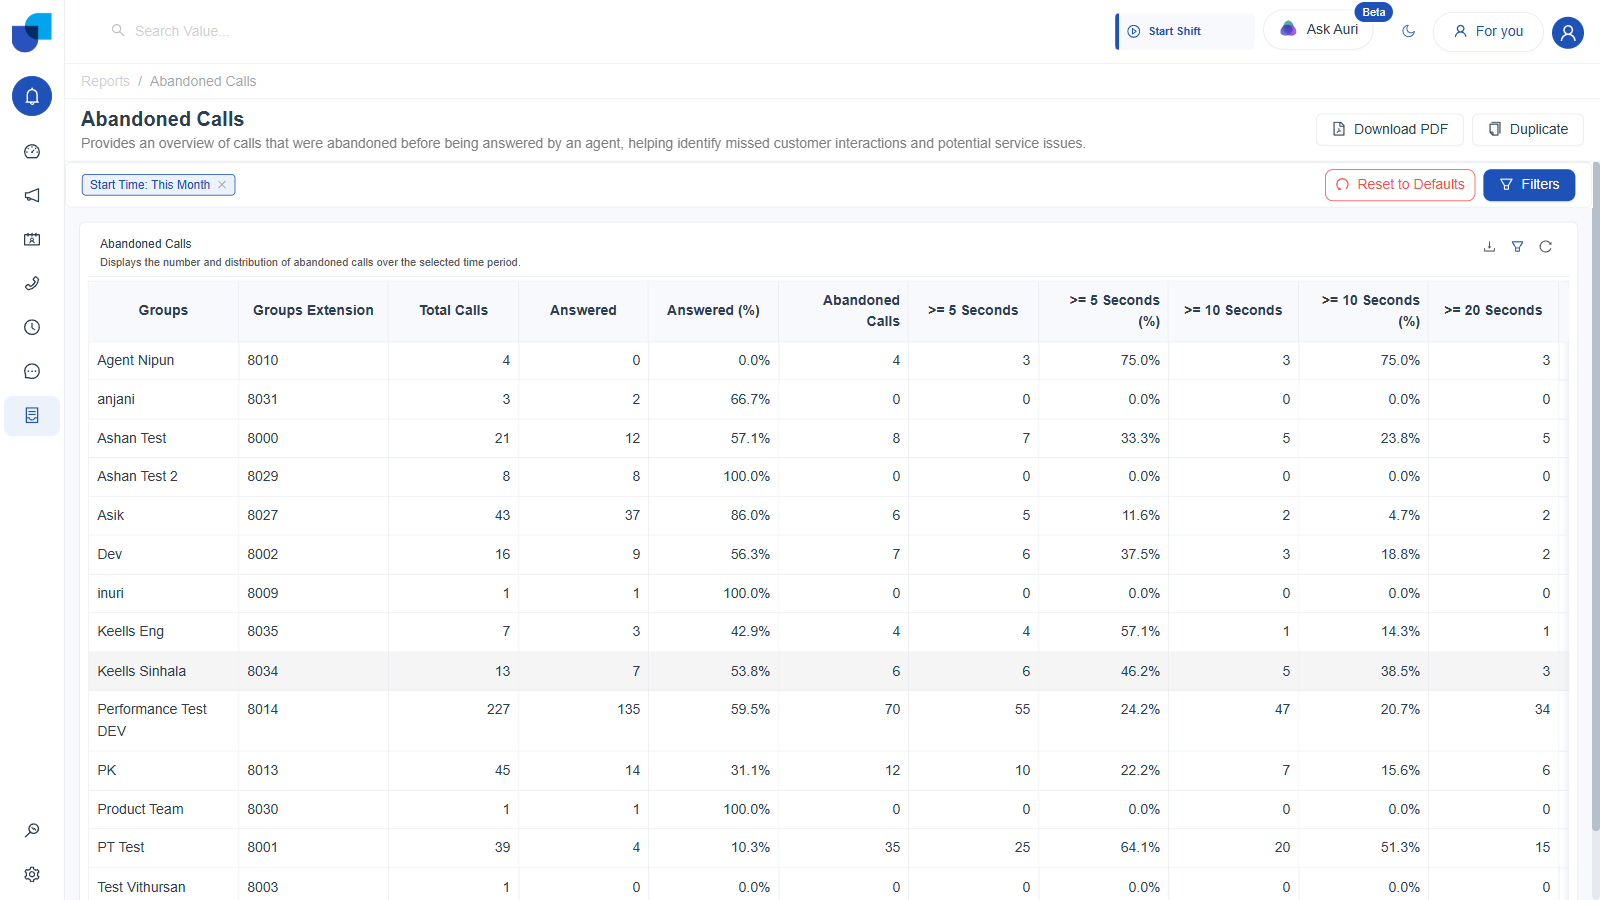
Figure 10. Abandoned Calls, generated with default filters: queue groups broken down by wait time threshold.
| Widget | Type | Logic | Shows |
|---|---|---|---|
| Abandoned Calls | Table | Count measures on the Calls module filtered to abandoned calls, grouped by the Groups (queue) dimension, with wait-time threshold measures bucketing abandonment by how long the caller waited. | Groups, Groups Extension, Total Calls, Answered, Answered (%), Abandoned Calls, >=5/10/20 Seconds counts and percentages. |
Queue Statistics
Mandatory filter: Start Time, defaults to This Month
Queue Statistics is also gated behind a mandatory Filters card on first open, with an optional Drop Call Interval (Sec) field, an optional Groups field, and a mandatory Start Time range defaulted to the current month. Generating the report produces a pivot table with Hour as the row dimension and Day as the pivoted column dimension, each day splitting into Total Calls, Answered, and Unanswered sub columns, with a bolded Total row summing every hour. Two independent granularity selectors, Start Time (Row) set to Hour and Start Time (Column) set to Day, control that pivot shape directly from the table's own toolbar. Because the row axis is Hour rather than Day, this report is built for finding which specific hours of a day carry the heaviest or lightest queue load, a level of detail none of the other built-in reports expose.
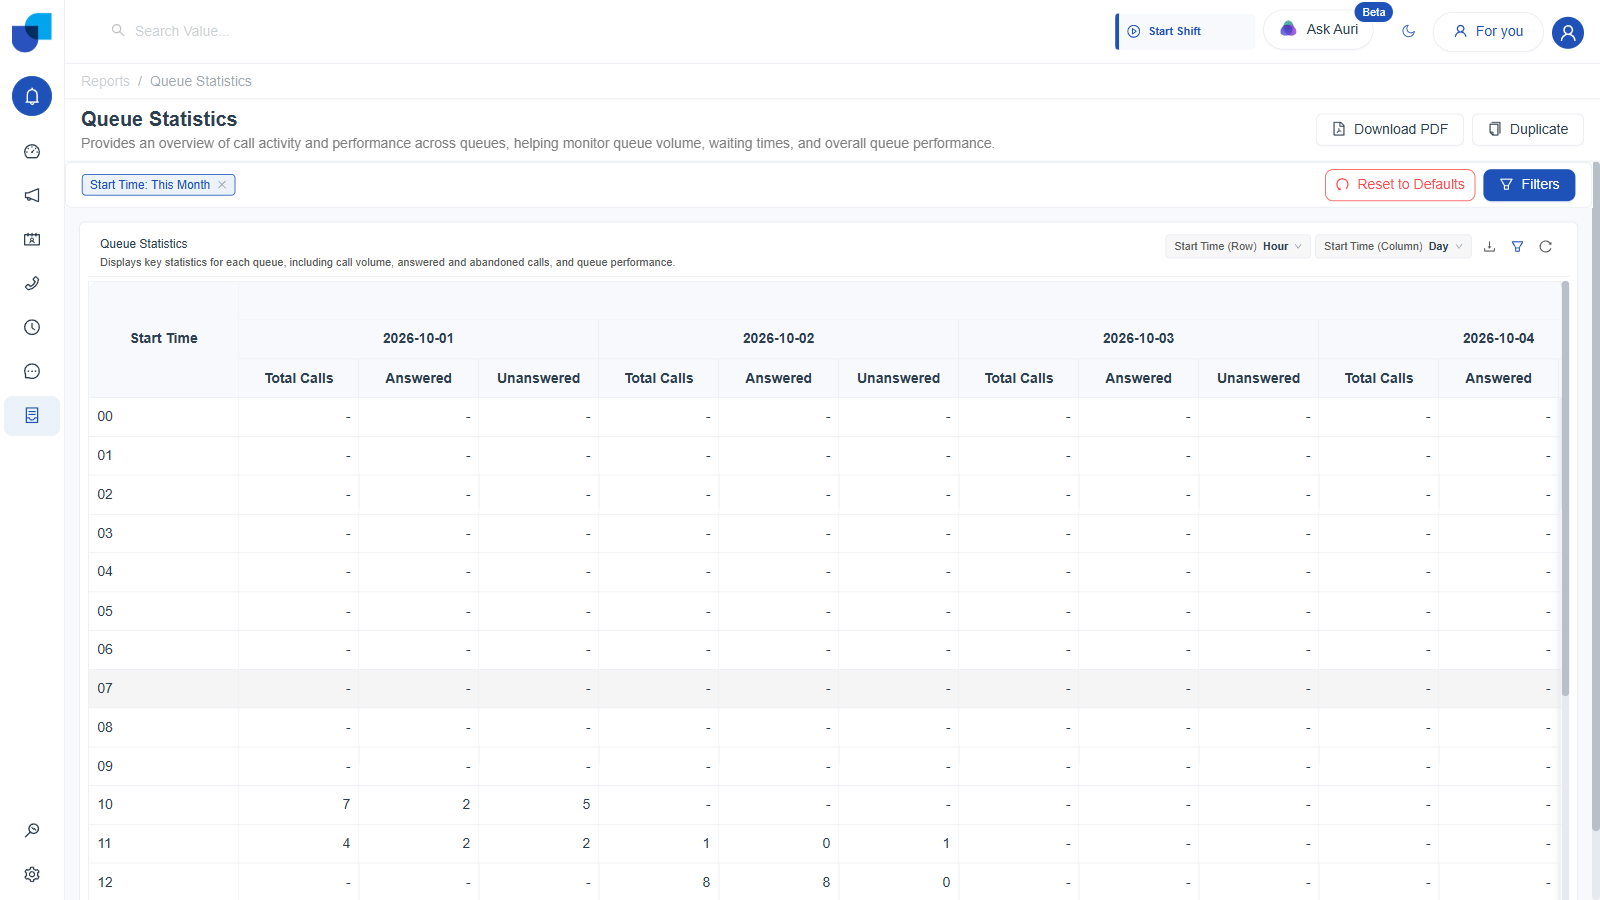
Figure 11. Queue Statistics, generated: Hour rows against Day columns, each split into Total Calls, Answered, and Unanswered.
| Widget | Type | Logic | Shows |
|---|---|---|---|
| Queue Statistics | Pivot table | Count measures on the Calls module, pivoted with Start Time (Hour) as rows and Start Time (Day) as columns, with a summed Total row. | Start Time (Hour) rows; Start Time (Day) columns, each split into Total Calls, Answered, Unanswered; a Total summary row. |
Activity Summary
Mandatory filter: Date Time, defaults to This Week
Activity Summary is gated behind a mandatory Filters card with a Date Time range, defaulted to the current week, plus optional Groups and Users fields. Generated output lists one row per agent, with sub rows for each distinct shift, Shift Duration in the second column, followed by a wide set of presence Status columns, AAA, After Call, AUX Break, Available, Away, Break, Custom 1, Dialing, Disconnected, and more, each cell holding the total time that agent spent in that status during that shift. The table is wide enough that it scrolls both vertically, through every agent and shift, and horizontally, through every status column, so reading it in full means using both scrollbars. Because Date Time defaults to the current week rather than the current month, this report surfaces a tighter and more current slice of presence data than Queue Statistics or Abandoned Calls do by default.
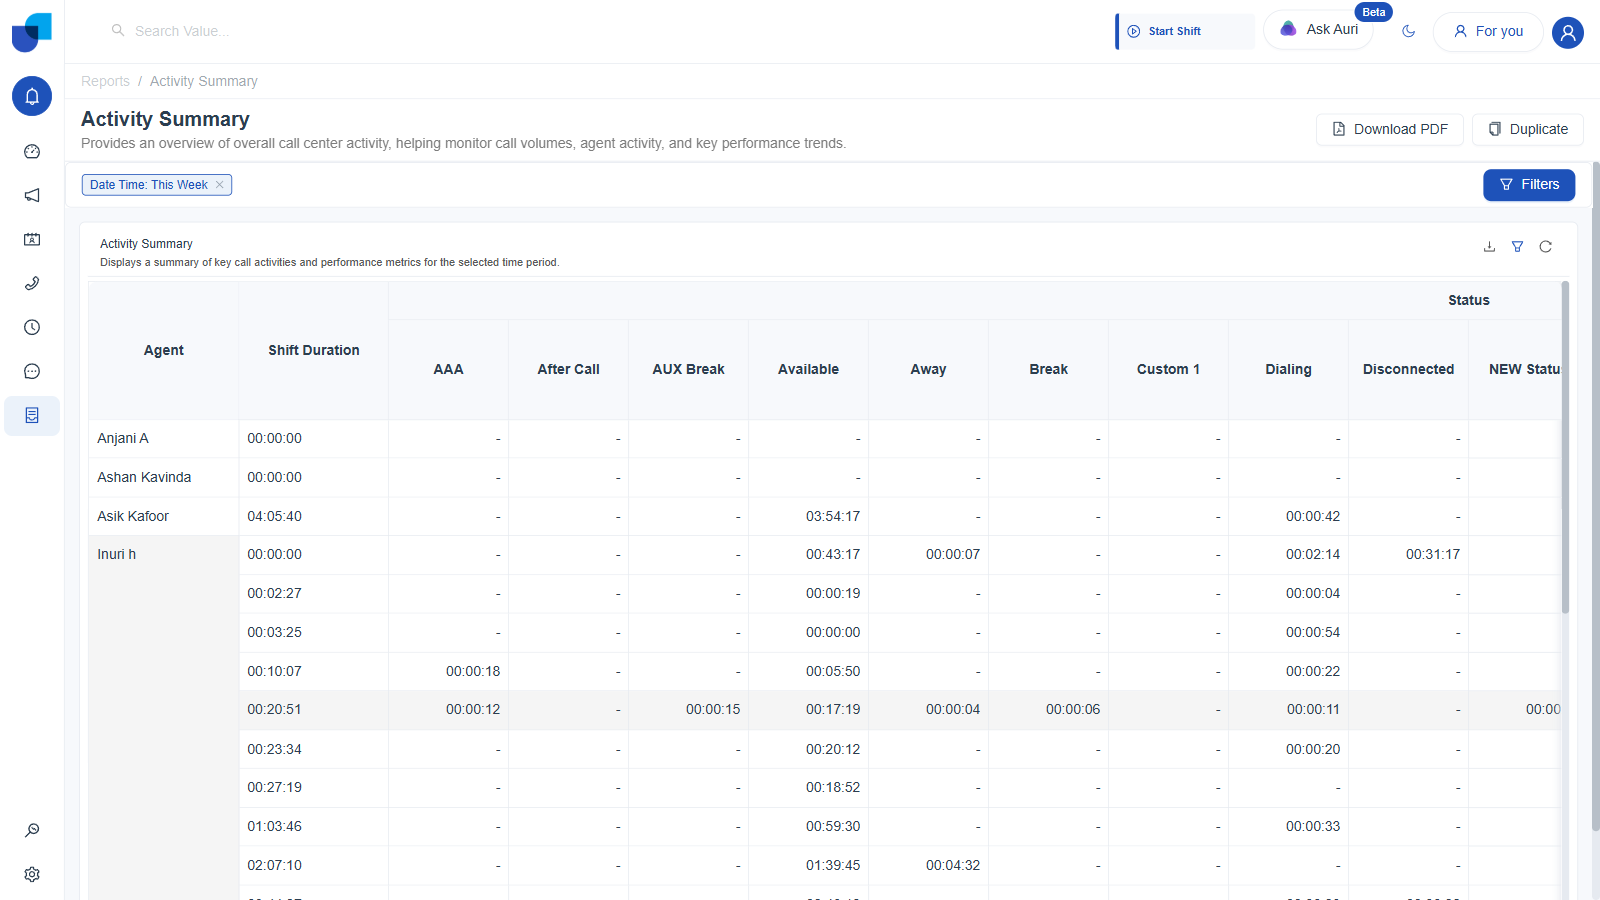
Figure 12. Activity Summary, generated: per-agent shifts against presence status columns like Available, Away, and Break.
| Widget | Type | Logic | Shows |
|---|---|---|---|
| Activity Summary | Table | Sum of duration measure on the presence/status module, pivoted with Agent and shift as rows and the Status dimension as columns. | Agent, Shift Duration, then one column per presence status: AAA, After Call, AUX Break, Available, Away, Break, Custom 1, Dialing, Disconnected, and more. |
Activity Report
Mandatory filter: Start Time, defaults to Today
Activity Report is gated behind a mandatory Filters card too, with a Start Time range defaulted to just today, plus optional Groups and Presence Statuses fields. Generated output is a flat, one row per status change table, Agent, Extension, Status, Timestamp, and Total Duration, ordered newest first, rather than the pivoted, per agent summary Activity Summary produces from similar underlying data. Even a single week's worth of status changes runs into the thousands, 1,175 rows with the Start Time range widened to This Week, paginated ten rows at a time across 118 pages. Status values are color coded chips, No Shift, Offline, Available, and Ringing all appeared among the first ten rows alone, making rapid visual scanning of an agent's status history straightforward even before reading the Timestamp column.
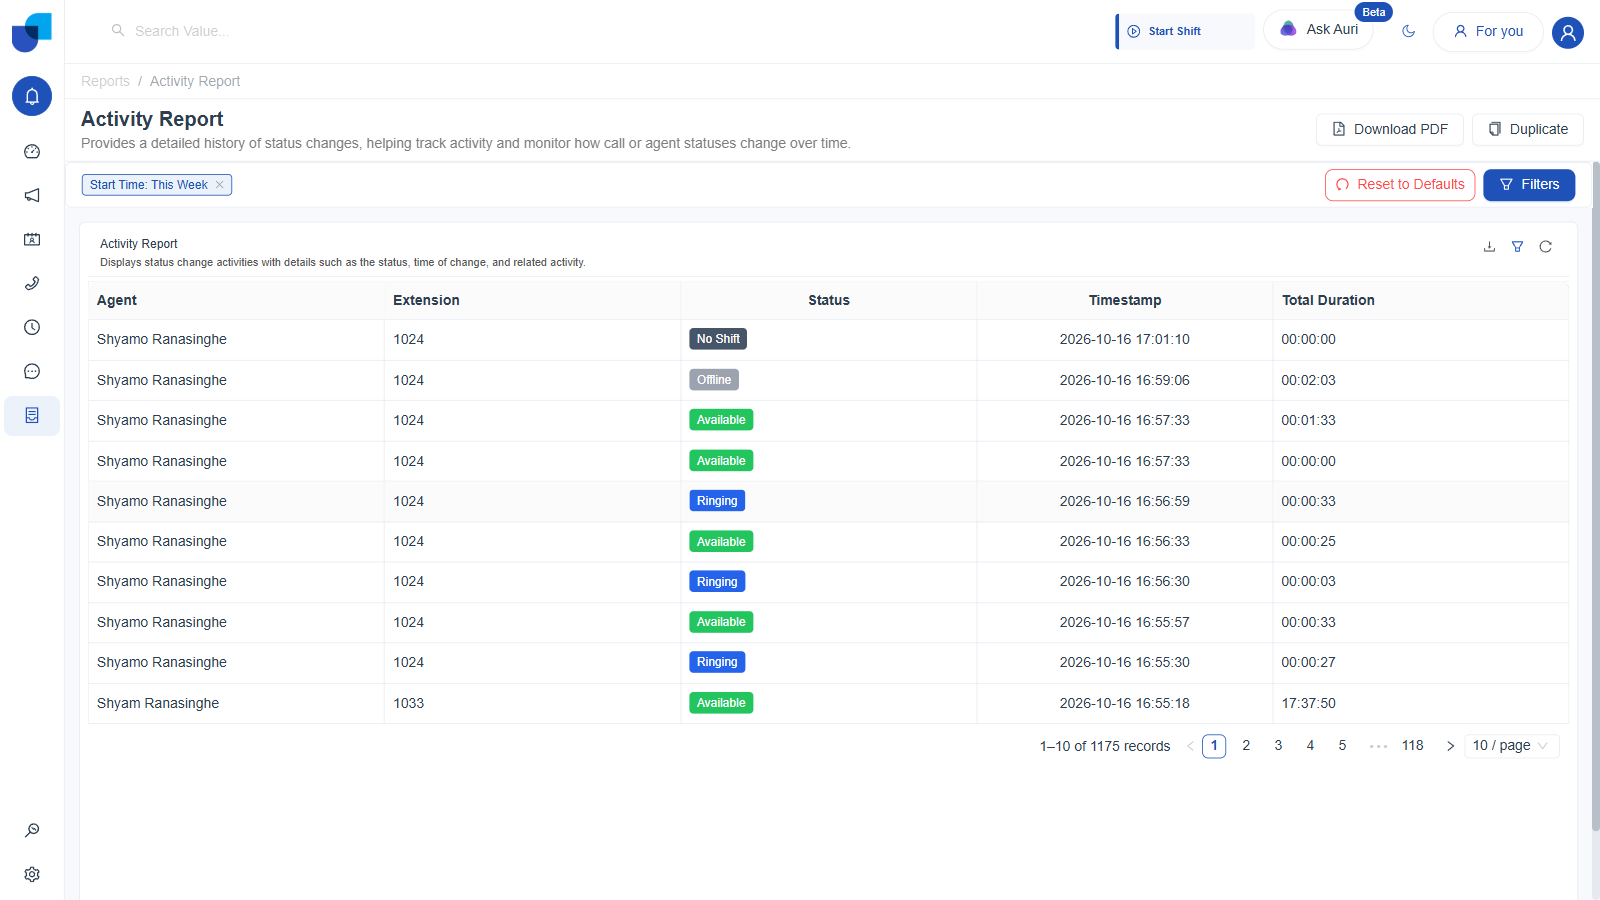
Figure 13. Activity Report, generated with Start Time widened to This Week: a flat log of status changes, newest first, 1,175 rows across 118 pages.
| Widget | Type | Logic | Shows |
|---|---|---|---|
| Activity Report | Table | Raw status-change rows from the presence/activity module, filtered by Start Time, no aggregation, ordered newest first. | Agent, Extension, Status, Timestamp, Total Duration. Newest first. |
Login History
Mandatory filter: Last Login at, defaults to Today
Login History is the simplest of the gated, System User-owned reports, with a mandatory Last Login at range, defaulted to today, plus optional Groups and Users fields. Generated output lists one row per user, Name, Extension, Last Login at, Last Activated at, and Duration, the length of that most recent session. Last Activated at is frequently blank, a dash, for users who have not triggered whatever separate activation event that column tracks, while Last Login at and Duration are populated for every row. With the Last Login at range widened to This Week, the report lists 22 rows paginated across three pages, giving a fuller picture of who has signed in and for how long.
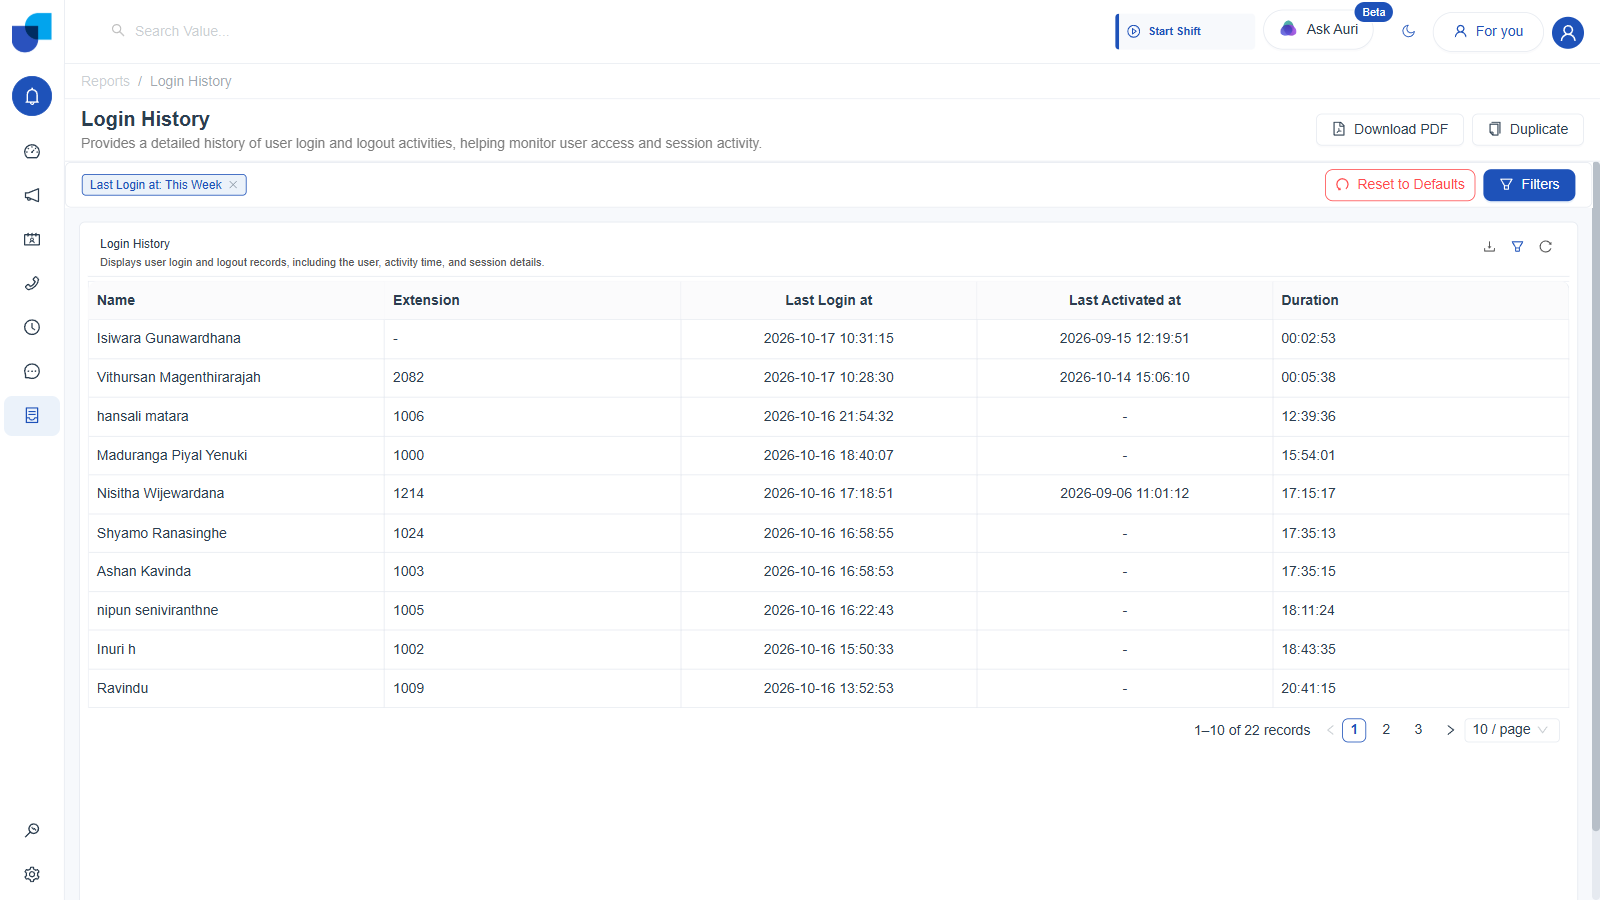
Figure 14. Login History, generated with Last Login at widened to This Week: 22 users, their last login time, and session duration.
| Widget | Type | Logic | Shows |
|---|---|---|---|
| Login History | Table | Raw login/session rows from the user session module, filtered by Last Login at, no aggregation. | Name, Extension, Last Login at, Last Activated at, Duration. |
The action set in the header is not identical across all twelve. Download PDF and Duplicate appear on every report. Share appears on Campaign Summary, Support Tickets Overview & SLA Intelligence, Sales Leads & Pipeline Conversion Report, and Accounts Directory & Portfolio Intelligence, but not on the other eight reports. No built-in report shows an Edit button. See Exporting & Sharing Reports for what each action does.