Data Fields & Schema
Every widget is built from fields exposed in the FIELDS panel, and every field maps to a real underlying model. The Schema view makes that mapping visible, right down to each column's data type. Everything below holds identically whether the Builder belongs to a dashboard or a report.
The FIELDS Panel
- In Team Report's Builder, on the Build tab, the left column is labeled FIELDS, with a search box, a link icon for joins, an fx icon for calculated fields, and a Schema button.
- Below that, modules are grouped under category chips: CRM, every custom CRM module such as Accounts, Contacts, Service Cases, Support Cases, and Leads, Telephony, Campaign, Conversations, Workflow, and Workforce Monitor.
- Click a module's row, or its + icon, to expand it into its individual fields.
- Use the search box at the top of the panel to filter the entire list by name, which is faster than scrolling once an environment has dozens of CRM modules, as this one does.
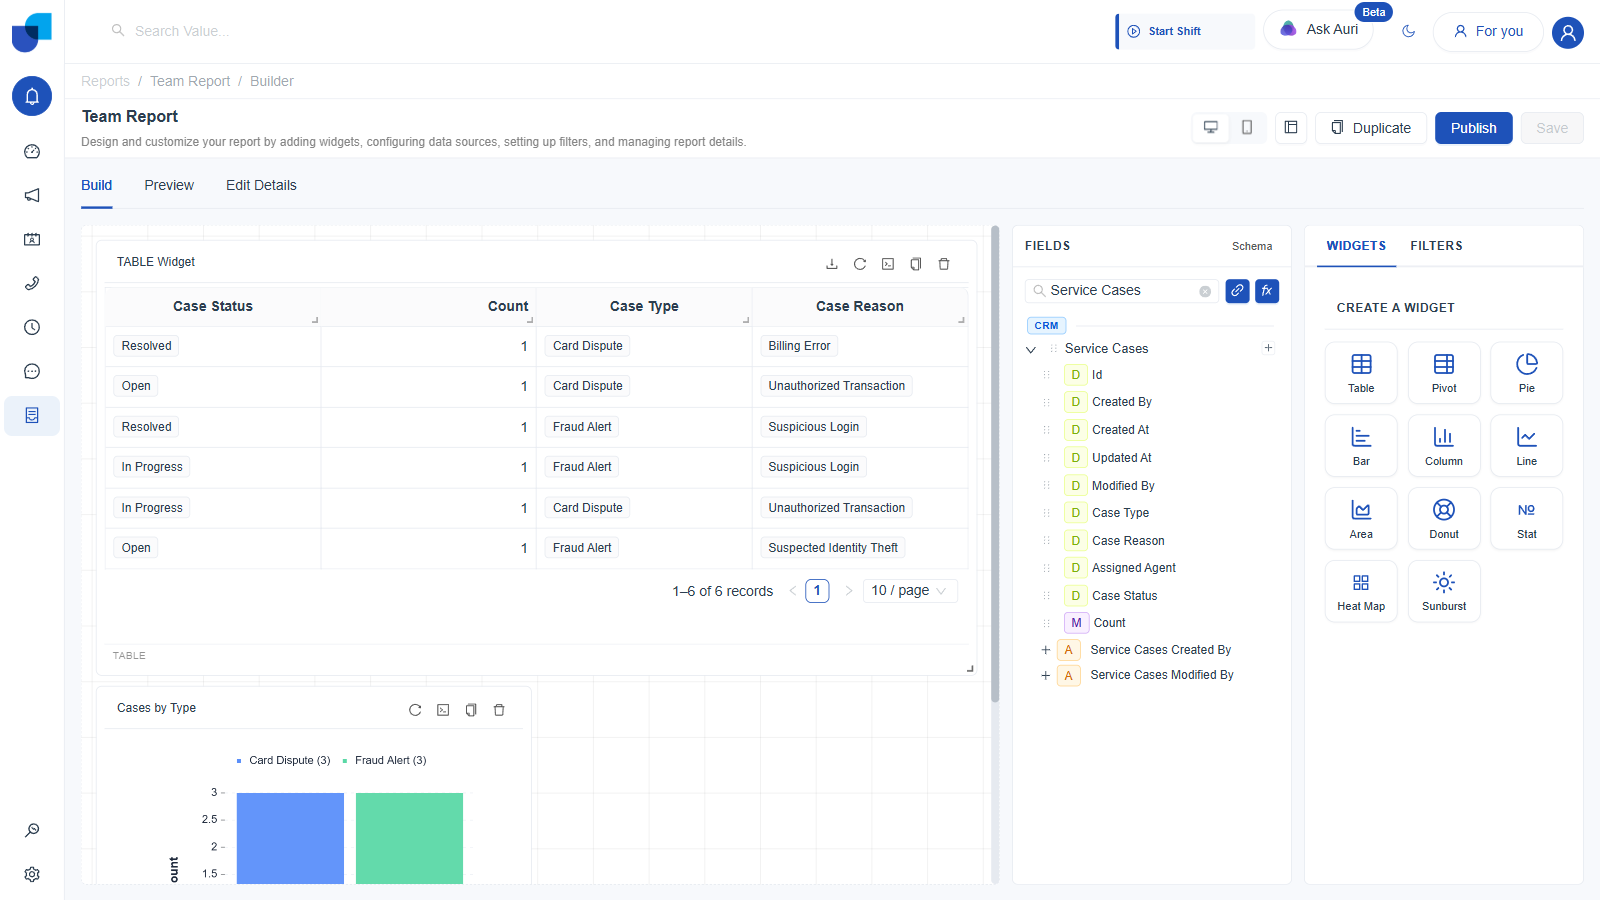
Figure 1. Service Cases expanded in Team Report's FIELDS panel: nine dimensions marked D, one measure marked M, Count, and two associations marked A pointing to Users.
Field Kinds
| Badge | Kind | Meaning |
|---|---|---|
D | Dimension | A value you group, filter, or label by. For example, on Service Cases: Id, Case Status, Case Type, Case Reason, Assigned Agent, Created At, Updated At, Created By, Modified By. |
M | Measure | A value you aggregate. Every module carries at least a Count measure, counting rows. |
A | Association | A relationship to another model. On Service Cases this showed up as Service Cases Created By and Service Cases Modified By, both pointing at the Users model. Each association carries its own plus icon to pull it directly into a widget. |
Dragging a field from a second module into a widget that already has a field from a different module greys out every other module in the panel. A single widget can query only one module at a time, unless you add a second source through the link icon. See Joins & Calculated Fields for exactly how that works.
Assigned Agent looks like a relationship, since it stores a Contacts record id, but it is a plain D dimension with no Association badge and no join back to Contacts. Dragging it into a Team Report widget returns the raw numeric id, for example 381, not a name, which is exactly why Team Report's own Table widget uses Case Reason instead of Assigned Agent. Getting a readable agent name into a widget means either looking the id up separately or using a calculated field, not dragging Assigned Agent directly.
The Schema View
- Click Schema in the FIELDS panel header, from inside Team Report's Builder. A full page diagram opens showing every model as a box, connected by relationship lines labeled
hasMany,belongsTo, orhasOne, each suffixed with the join key in parentheses, for examplebelongsTo (assignedTo). - Two scope buttons sit top left: In Report, labeled with a live count such as
In Report (1), shows only the modules actually used by a widget in Team Report, and All Models opens the organization's entire schema. On Team Dashboard the same button reads In Dashboard instead. - Switching to All Models reveals a second dropdown, All Modules, with a live count next to it and a breakdown by the same categories the FIELDS panel uses: CRM, Telephony, Campaign, Conversations, Workflow, and Workforce Monitor, each with its own count, letting the diagram be narrowed to one category instead of all modules.
- Toggle Detail Level between Compact, model names only, and Full Schema, every column, with its data type and a PK or FK badge where relevant.
- Use the filter box at the top left to narrow the diagram to one model. Typing "Service Cases" isolates just that box. In All Models scope it keeps the box's direct relationships, while in In Report scope, where every other model is already excluded because Team Report only uses Service Cases, it simply zooms to that one box alone.
- Use the zoom controls in the top right, or the mouse wheel, to zoom in and read column names on a dense diagram, and drag anywhere on the canvas to pan.
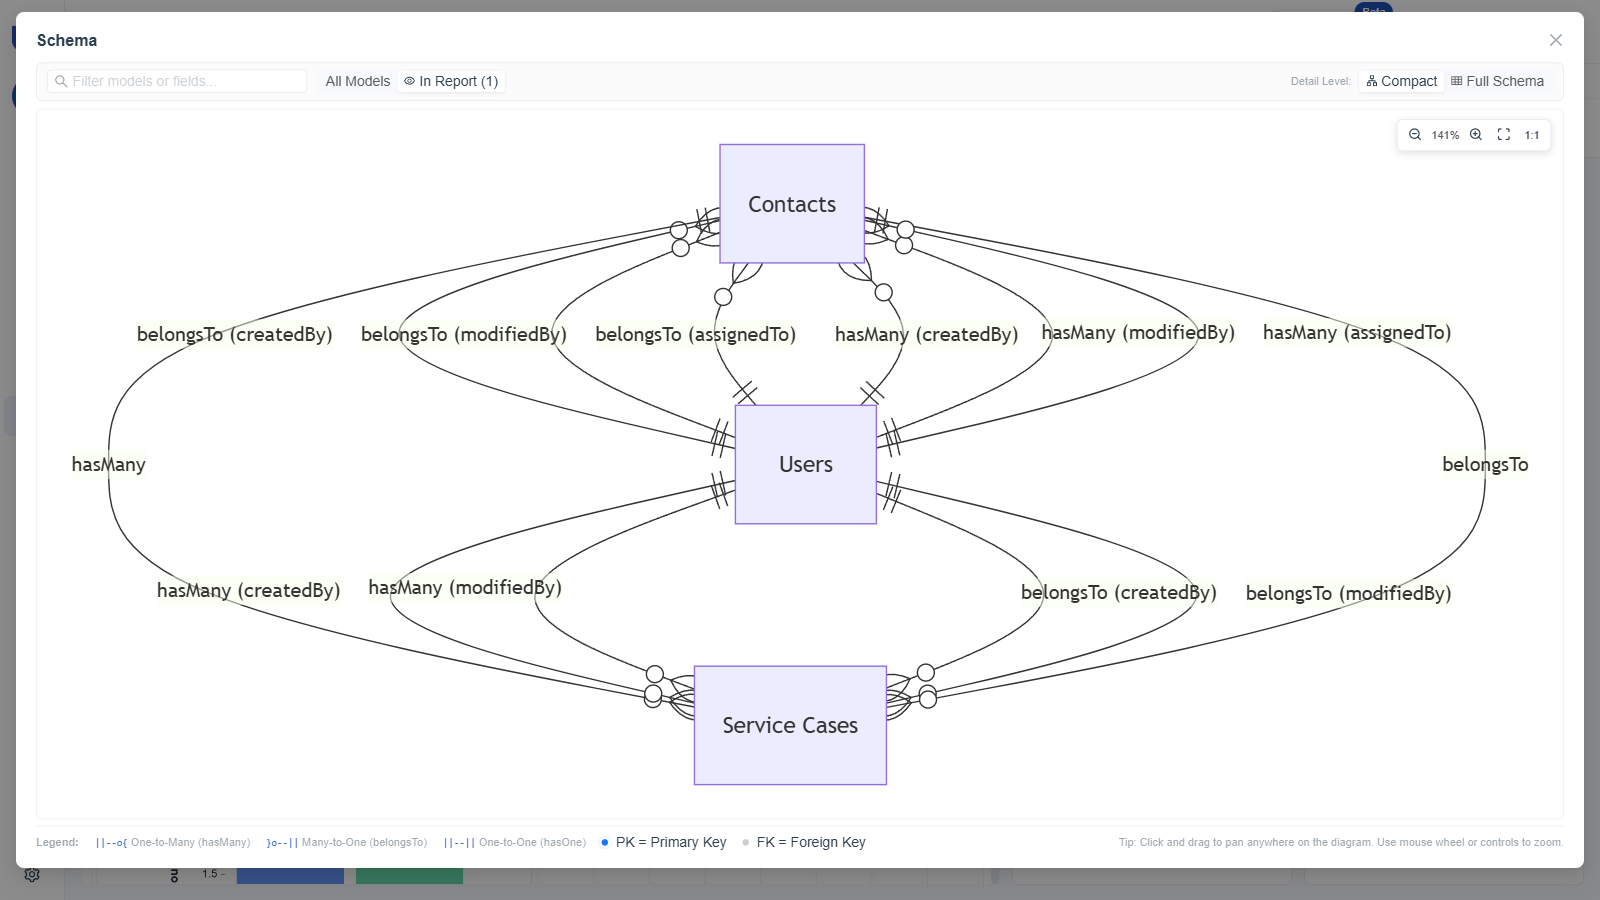
Figure 2. Compact Schema, scoped to In Report (1) on Team Report: Contacts, Users, and Service Cases connected by hasMany and belongsTo relationships, each labeled with its join key.
| Category | Modules |
|---|---|
| All Modules | 65 |
| CRM | 37 |
| Telephony | 4 |
| Campaign | 8 |
| Conversations | 3 |
| Workflow | 2 |
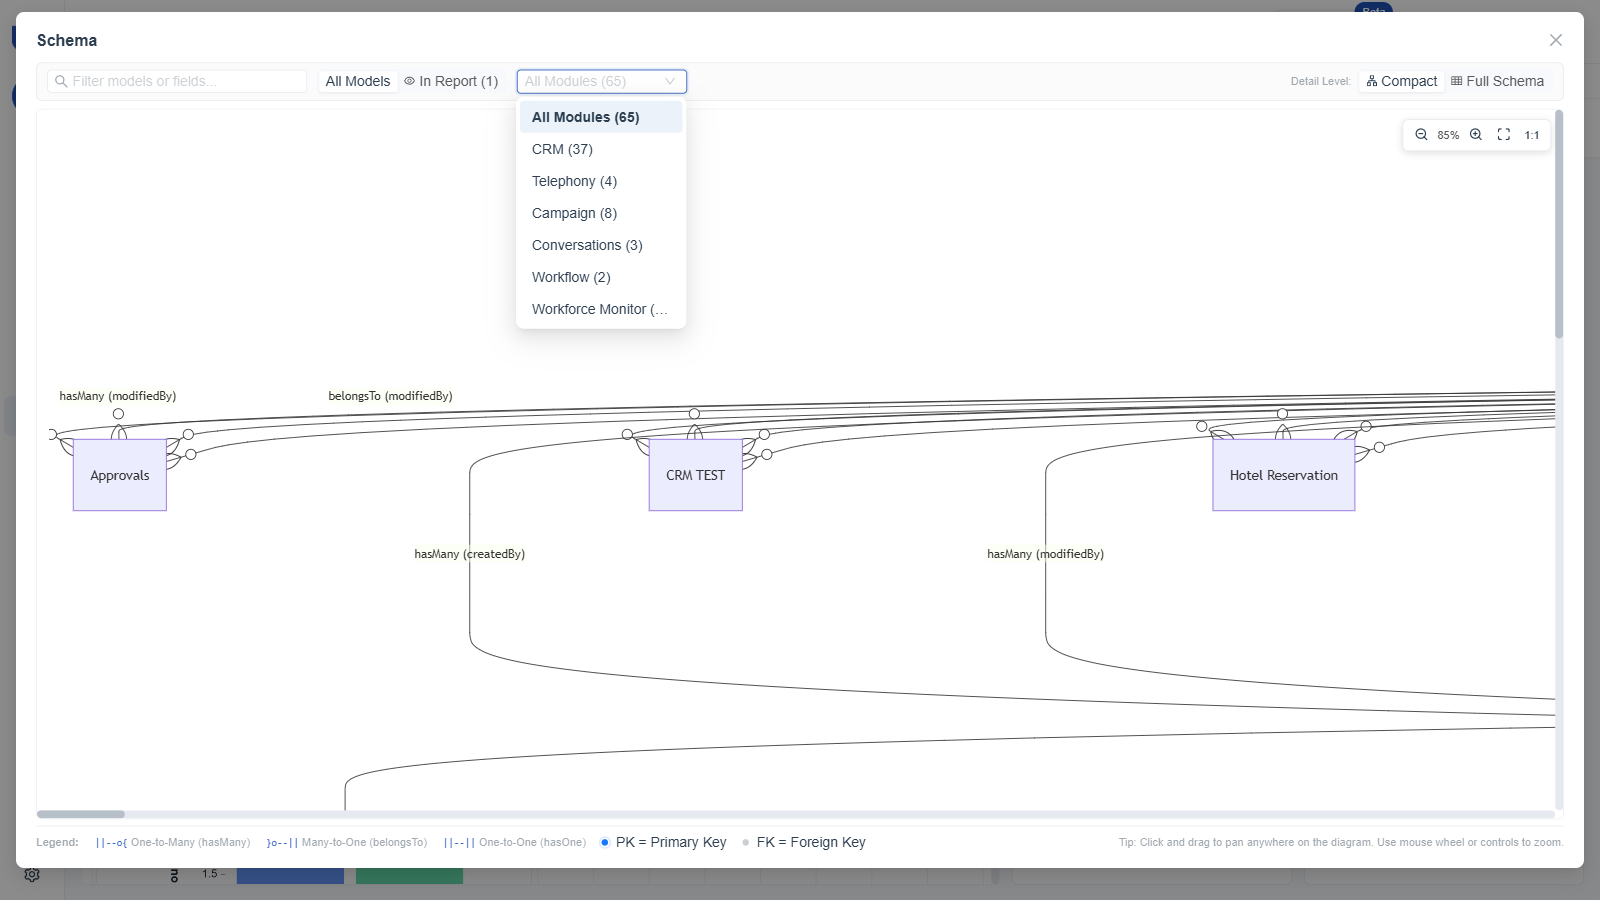
Figure 3. Switching to All Models scope adds this category dropdown: 65 modules total across the organization, broken down the same way the FIELDS panel groups them.
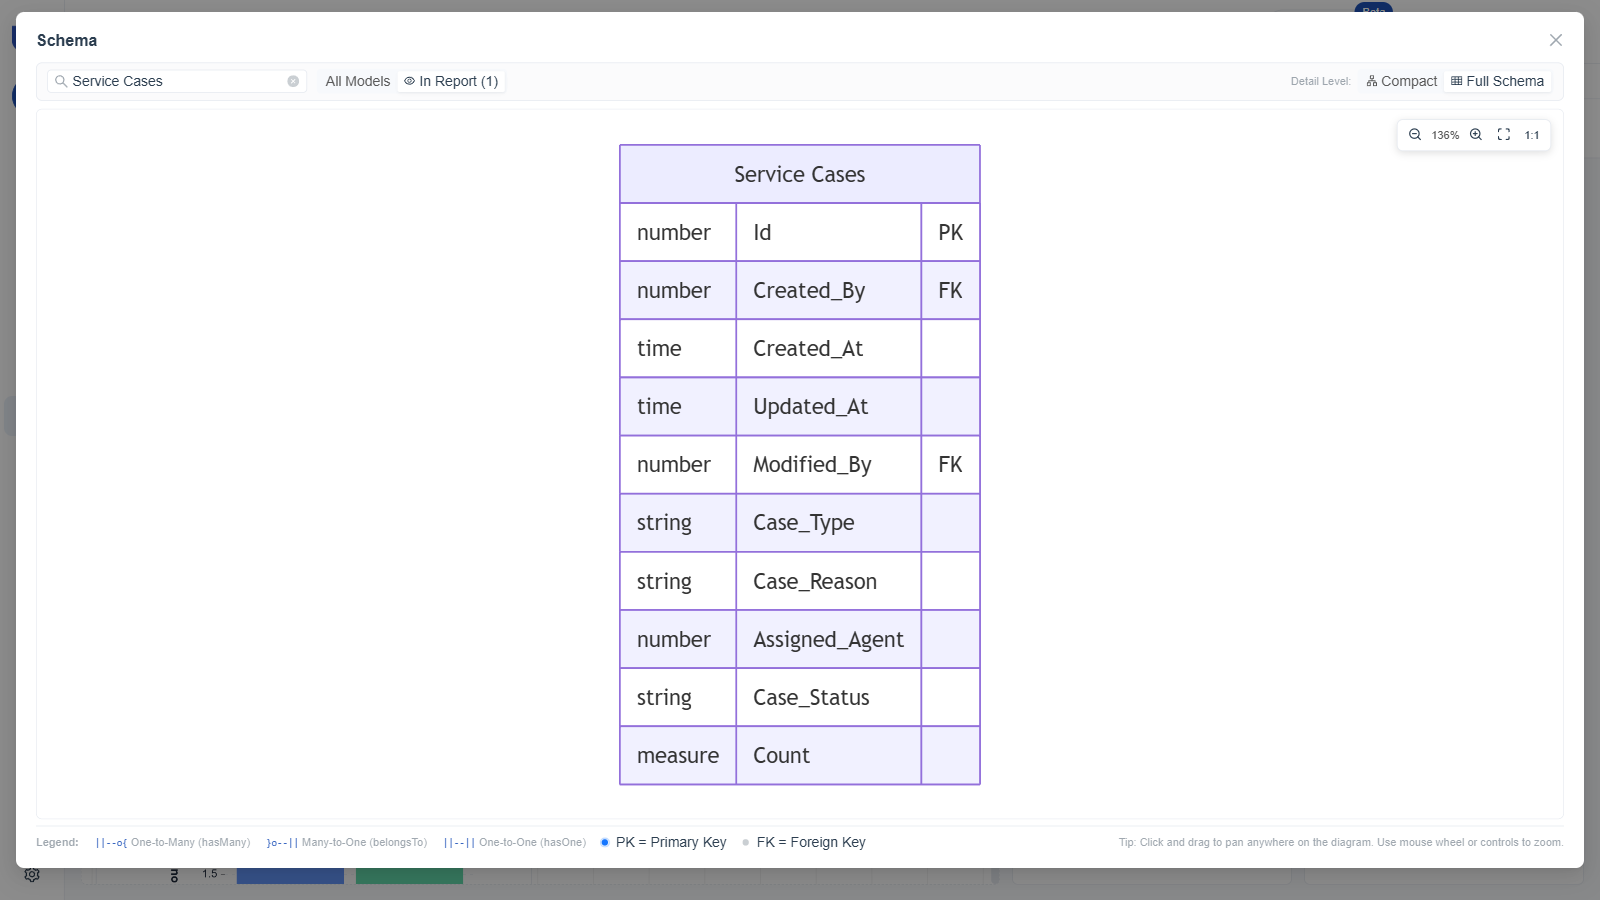
Figure 4. Full Schema, filtered to Service Cases: every column with its data type and key badge.
Filtered to Service Cases, the Full Schema view shows ten columns in total: a numeric primary key Id, two numeric foreign keys Created_By and Modified_By, two time columns Created_At and Updated_At, three string columns Case_Type, Case_Reason, and Case_Status, a plain numeric column Assigned_Agent with no key badge at all, and one measure column labeled simply Count. These are exactly the fields Team Report's own Table and Column chart widgets draw on.
The Schema view's column names, such as Case_Status, are display labels, not the raw SQL column names underneath them. The Calculated Field dialog's Code tab shows that the real reference the platform works with is a cube layer name, crmServiceCases.caseStatus, camelCase and prefixed with the module, not the Schema diagram's underscore-separated label and not a raw SQL column. Whatever the field is ultimately stored under in the database is not exposed anywhere in the Widget Builder, including that autocomplete. See Joins & Calculated Fields for how that surfaced.
Legend
| Symbol | Meaning |
|---|---|
||--o{ | One to many, labeled hasMany |
}o--|| | Many to one, labeled belongsTo |
||--|| | One to one, labeled hasOne |
PK | Primary Key |
FK | Foreign Key |
Before building a widget that needs two modules together, open Schema and filter to each one first. Seeing whether the relationship is hasMany, belongsTo, or hasOne tells you which side of a join will multiply rows, which matters once you get to Blended Data Sources. Switching to All Models first is the fastest way to find a module whose exact name you do not already know, since In Report scope only ever shows what Team Report is already using.