Creating a Report
A full, start to finish walkthrough: creating a new report, naming it, and wiring its first widget to real Service Cases data. The example used throughout, Team Report, is a report built specifically for this page, not one of the twelve built in reports covered in Built-in Reports.
Step 1. Open the Create Dialog
- From the left rail, open Reports.
- Click Create in the top right corner of the list page.
- A Create Item modal opens with the same three fields a dashboard's Create dialog has: Title, required, Description, required, and Icon, a searchable combobox listing named icons such as
BarChartOutlinedorLoginOutlined.
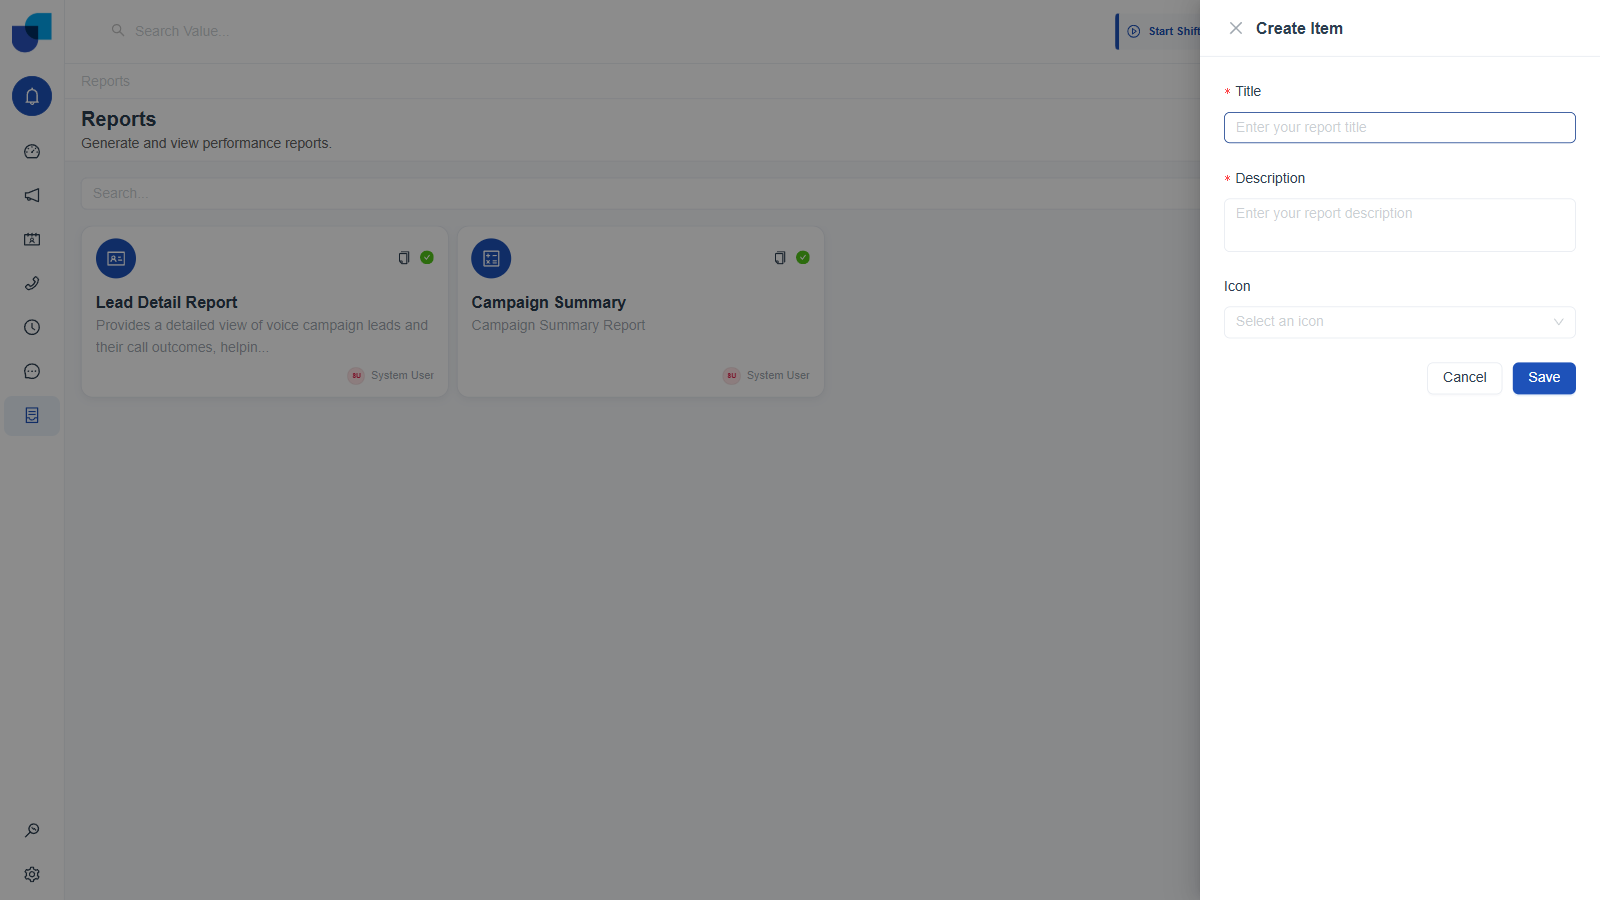
Figure 1. Create Item dialog: Title, Description, and the searchable Icon combobox.
Step 2. Name It and Pick an Icon
- Type a Title and a Description. Both are required. The Save button stays inert until both fields are filled.
- Click the Icon field and type to filter it, for example typing "bar" narrows the list to matching icon names live, as you type.
- Select an icon from the filtered list.
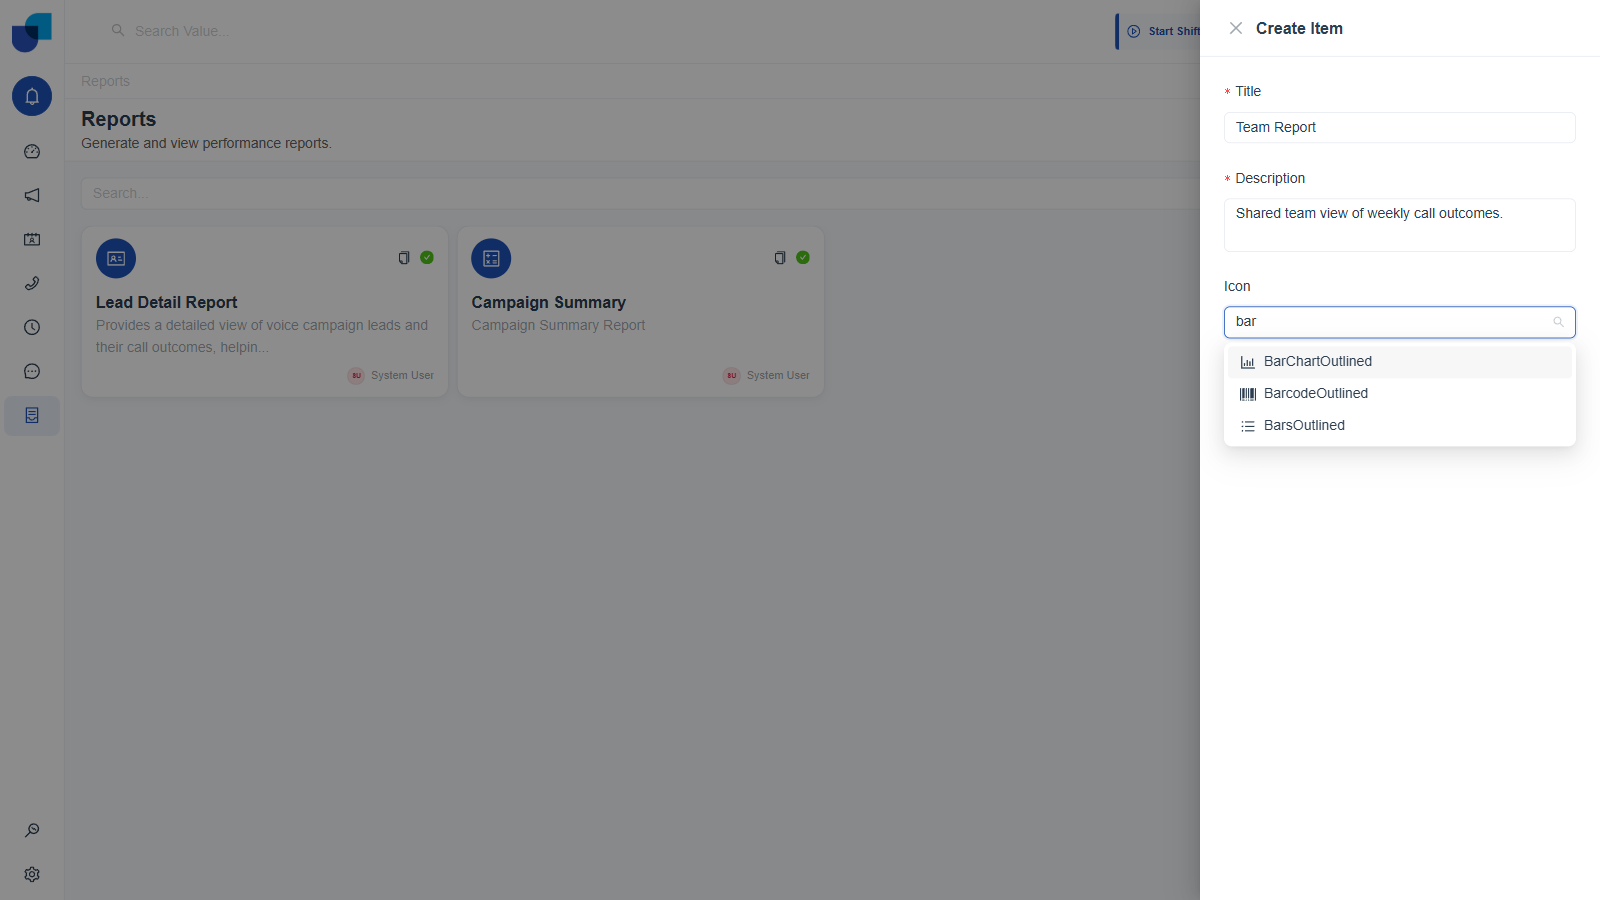
Figure 2. Typing "bar" into the Icon field filters the combobox to matching icon names.
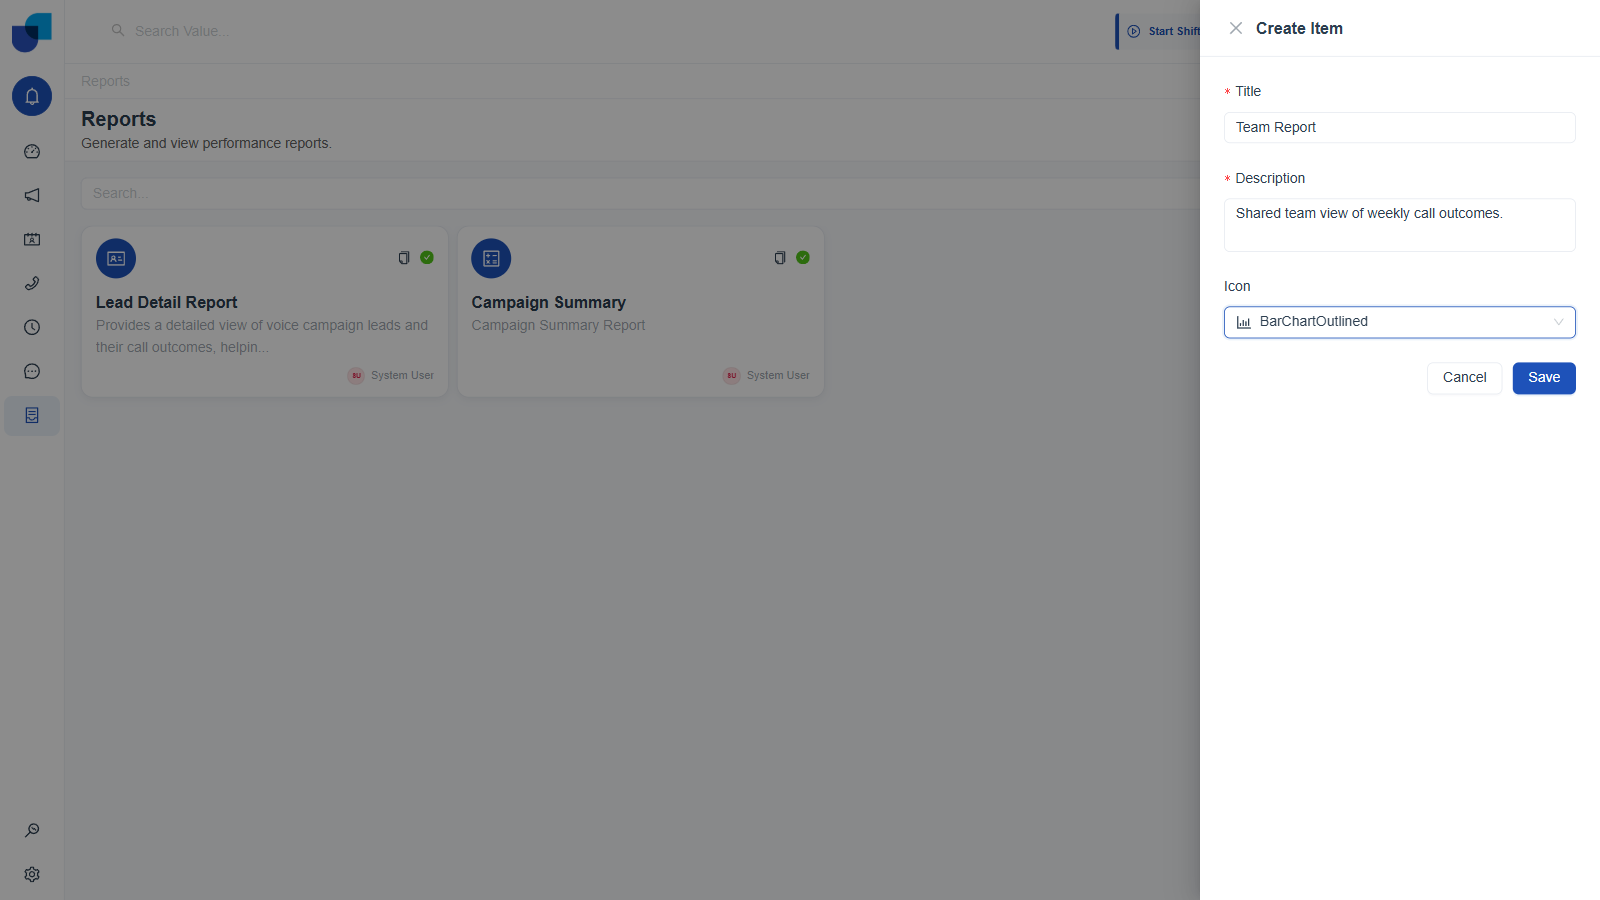
Figure 3. A filled in Create Item dialog for Team Report, ready to save.
Step 3. Save and Land in the Builder
- Click Save. Unlike a new dashboard, no success toast appears. You are simply navigated straight to
/reports/{id}/builder. - The Builder opens on the Build tab: an empty canvas reading "Add a widget to get started," a FIELDS panel on the left listing every module across CRM, Telephony, Campaign, Conversations, Workflow, and Workforce Monitor, and a WIDGETS / FILTERS panel on the right.
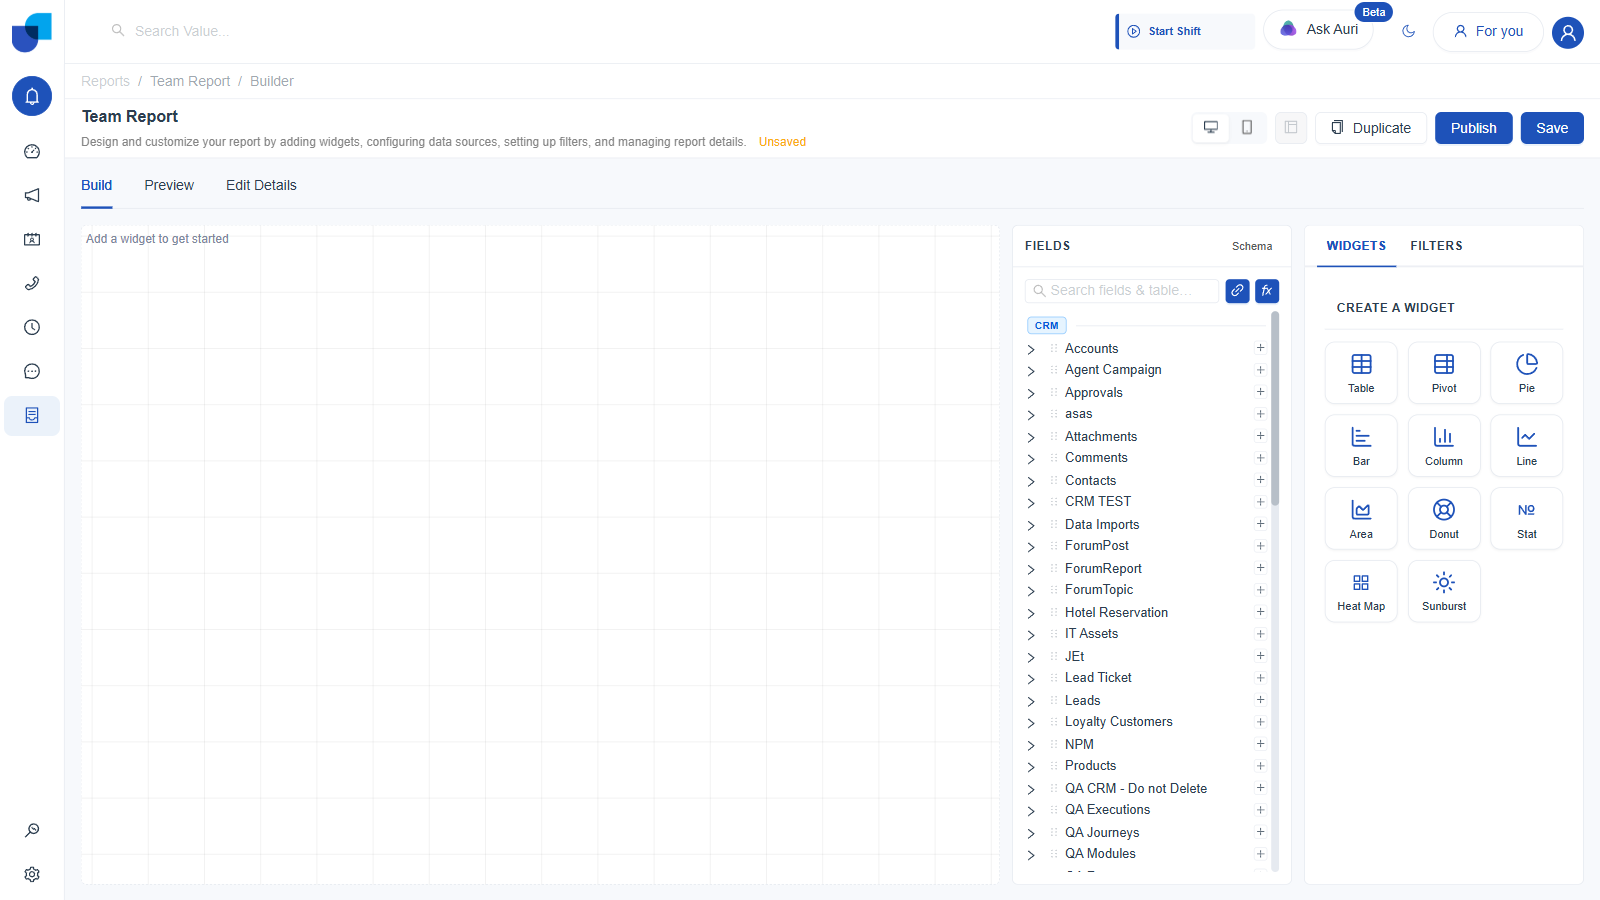
Figure 4. The Report Builder immediately after creation. Empty canvas, FIELDS panel, WIDGETS panel.
Step 4. Add Your First Widget
- In the right panel's WIDGETS tab, click a widget type. Table is shown here, the same starting point used in Creating a Dashboard.
- In the left FIELDS panel, search for a module, for example type Service Cases, then expand it to reveal its fields: dimensions marked
D, a measure markedM, and associations markedA. - Drag a dimension, for example Case Status, onto the Columns drop zone in the Configure panel. The table renders live with real rows immediately.
- Drag the Count measure onto Columns as well, after Case Status, to add an aggregated count column.
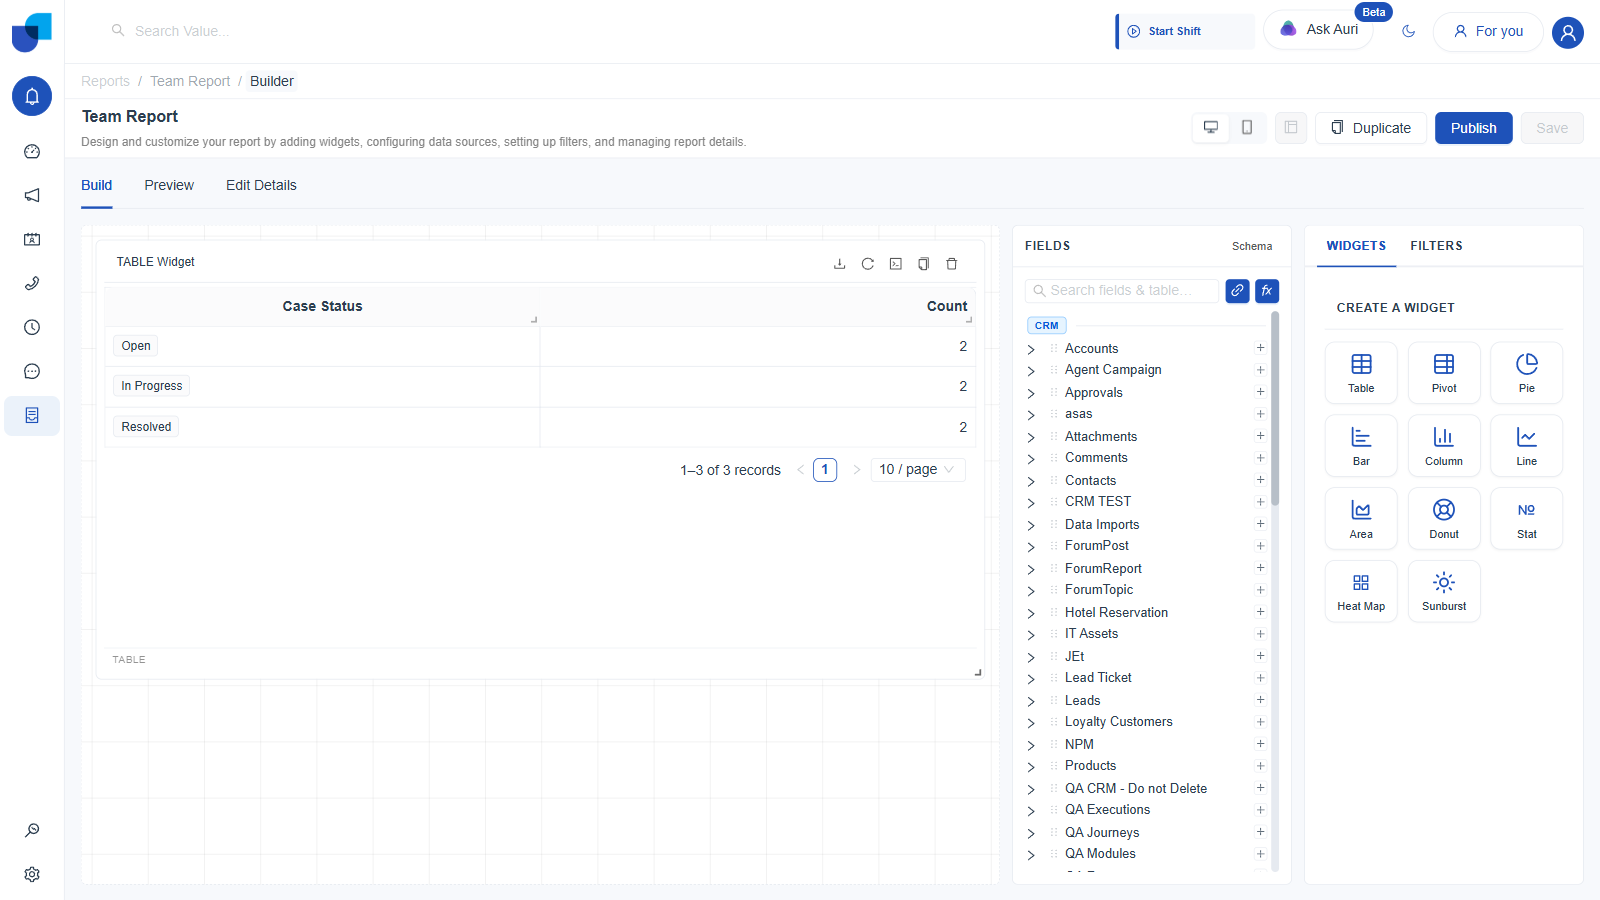
Figure 5. A working Table widget: Case Status and Count columns, built by drag and drop, rendering real data.
As with a dashboard widget, once a widget has a field from one module in its Columns, every other module in the FIELDS panel greys out and becomes unselectable for that widget.
A report's Table widget also carries a Time Configuration drop zone a dashboard's Table widget does not have, for pivoting the table by a date dimension, and its Row Limit goes up to 10,000 rather than the 20 a dashboard widget allows.
Step 5. Save
Click Save in the header once you are happy with the widget. The report stays in Hidden visibility until you explicitly publish it, which is covered in Exporting & Sharing Reports.
| Field | Required | Notes |
|---|---|---|
| Title | Yes | Shown on the list card and as the page heading everywhere the report appears. |
| Description | Yes | Shown on the list card, under the title in the Builder, and on the published or shared consumer view. |
| Icon | No | Searchable combobox of named icons. Purely cosmetic, shown on the list card and in left nav shortcuts. |
Adding a Second Widget
Nothing stops you from adding more widgets to the same canvas. Click a second type in WIDGETS, configure it the same way, and it appears below the first on the canvas. Once a report has two or more widgets, the previously disabled arrange button in the header becomes active, letting you drag widgets into a custom layout rather than the default stacked order, exactly as it does on a dashboard.