Widget Types
The WIDGETS tab offers eleven visualization types. Each one is covered below with its own Configure panel.
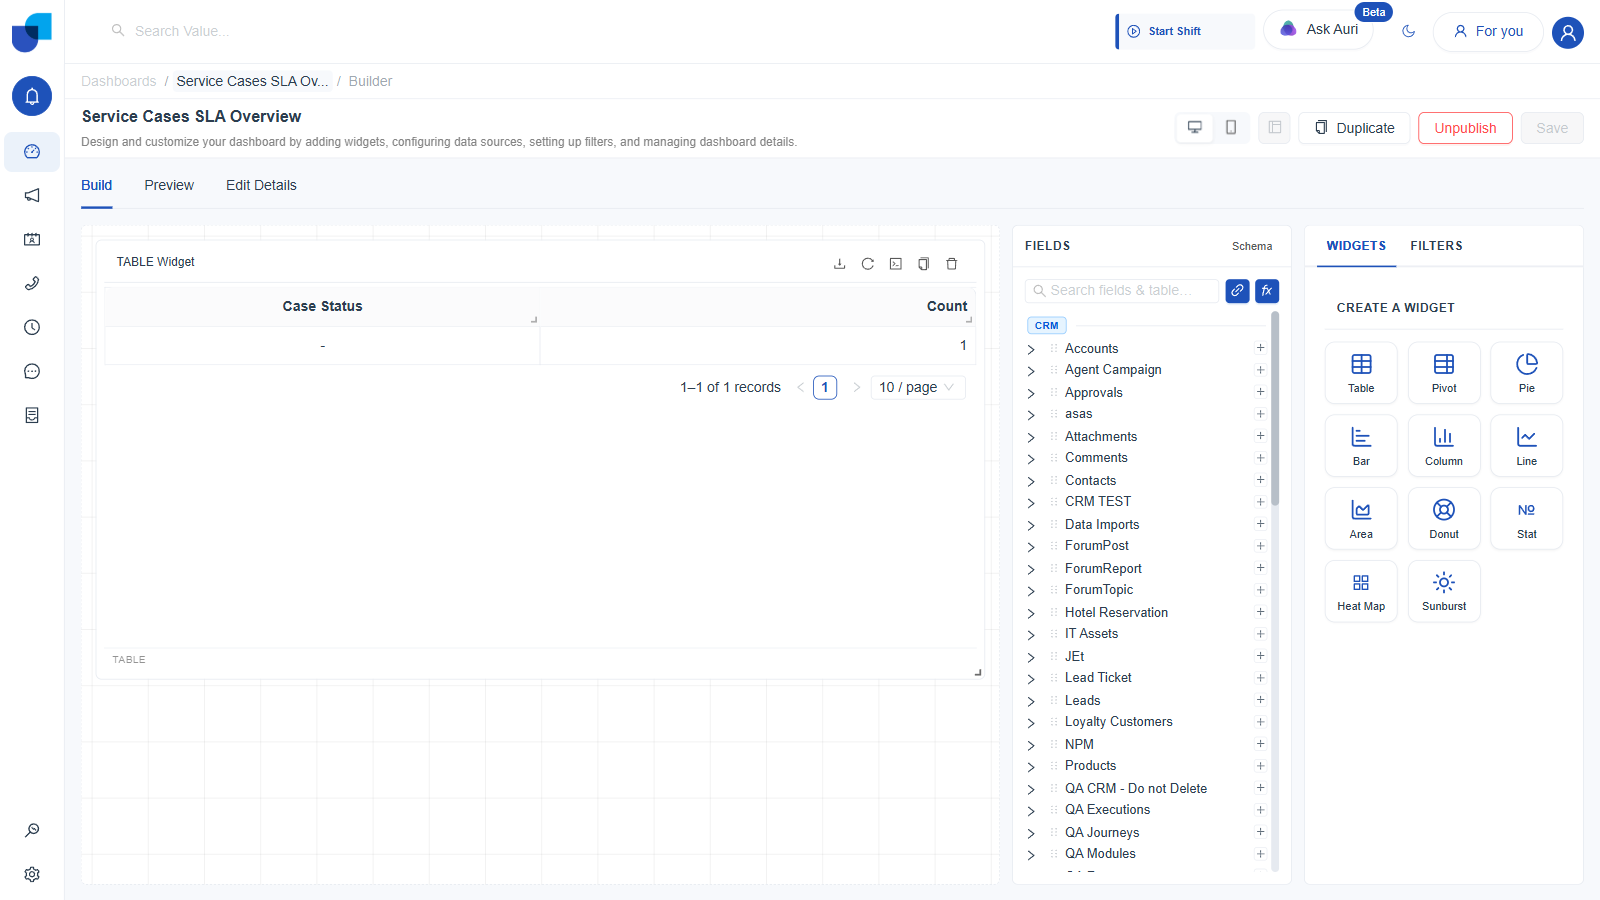
Figure 1. The CREATE A WIDGET grid in the WIDGETS tab, showing all eleven types.
Widget Header Actions, Common to All Types
Once any widget is created, its header grows a small toolbar. Table widgets get five icons. Every other type gets four, because the Download action, export to Excel, only appears on Table widgets. Side by side on Team Dashboard, its Table widget's header carries Download, Refresh, View Query, Duplicate, Delete, while its Cases by Type column chart widget carries only Refresh, View Query, Duplicate, Delete.
| Icon | Present On | What It Does |
|---|---|---|
| Download | Table only | Exports the widget's rows as an .xlsx file. |
| Refresh | All eleven types | Re-runs the widget's query against current data. |
| View Query | All eleven types | Opens a Widget Query dialog showing the widget's underlying query as JSON. On Team Dashboard's own Table widget, for example: {"limit": 10, "measures": ["crmServiceCases.count"], "dimensions": ["crmServiceCases.caseStatus"], "timezone": "Asia/Colombo", "offset": 0}, exactly the measures, dimensions, limit, timezone, and offset fields this dialog is built around. |
| Duplicate | All eleven types | Clones the widget, config and all, within the same dashboard or report. |
| Delete | All eleven types | Opens a confirmation dialog, "Delete this widget permanently?", before removing it. |
1. Table
The most general type, and the one used throughout the rest of this documentation. A Table widget lays out any number of fields as plain columns, with no implied chart shape.
- Click Table in CREATE A WIDGET.
- Set a Title and optional Description.
- Drag any number of dimension and measure fields onto Columns. Each column chip carries its own mini toolbar: Fill Missing Gaps, Freeze Column, an edit icon, and a remove icon.
- Optionally drag a field onto Filters to scope just this widget. Calculated fields are explicitly not supported here.
- Optionally drag a date or time dimension onto Time Configuration.
- Optionally drag a field onto Sorting. Calculated fields are not supported here either.
- Pick a Row Limit: 50, 100, 200, or Custom, up to 10,000.
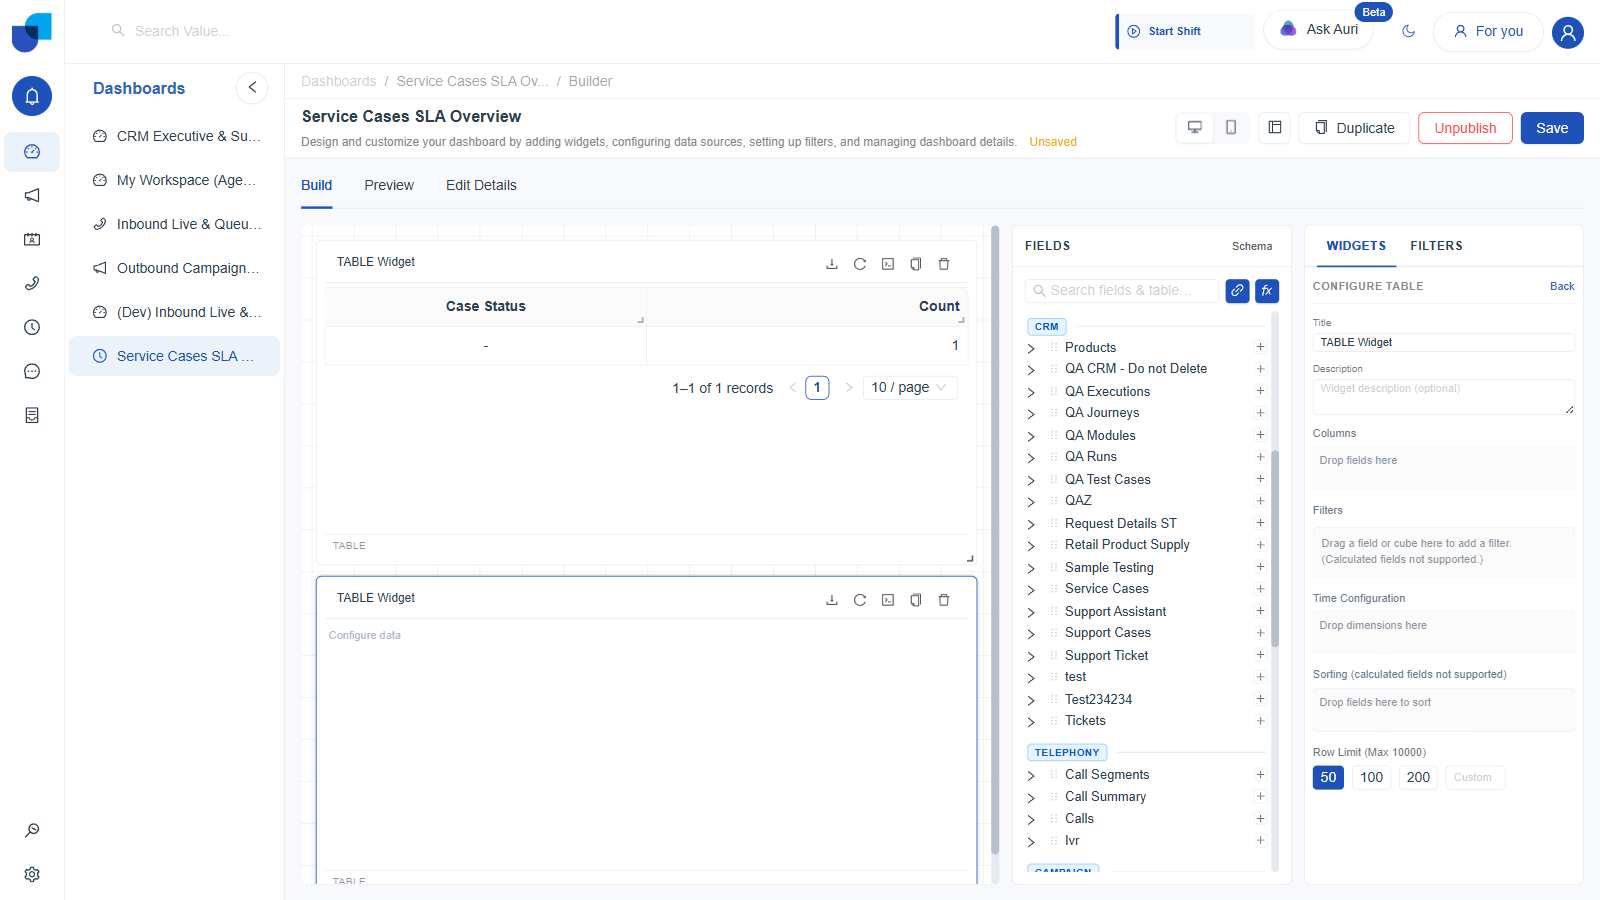
Figure 2. A freshly created Table widget with an empty Configure Table panel.
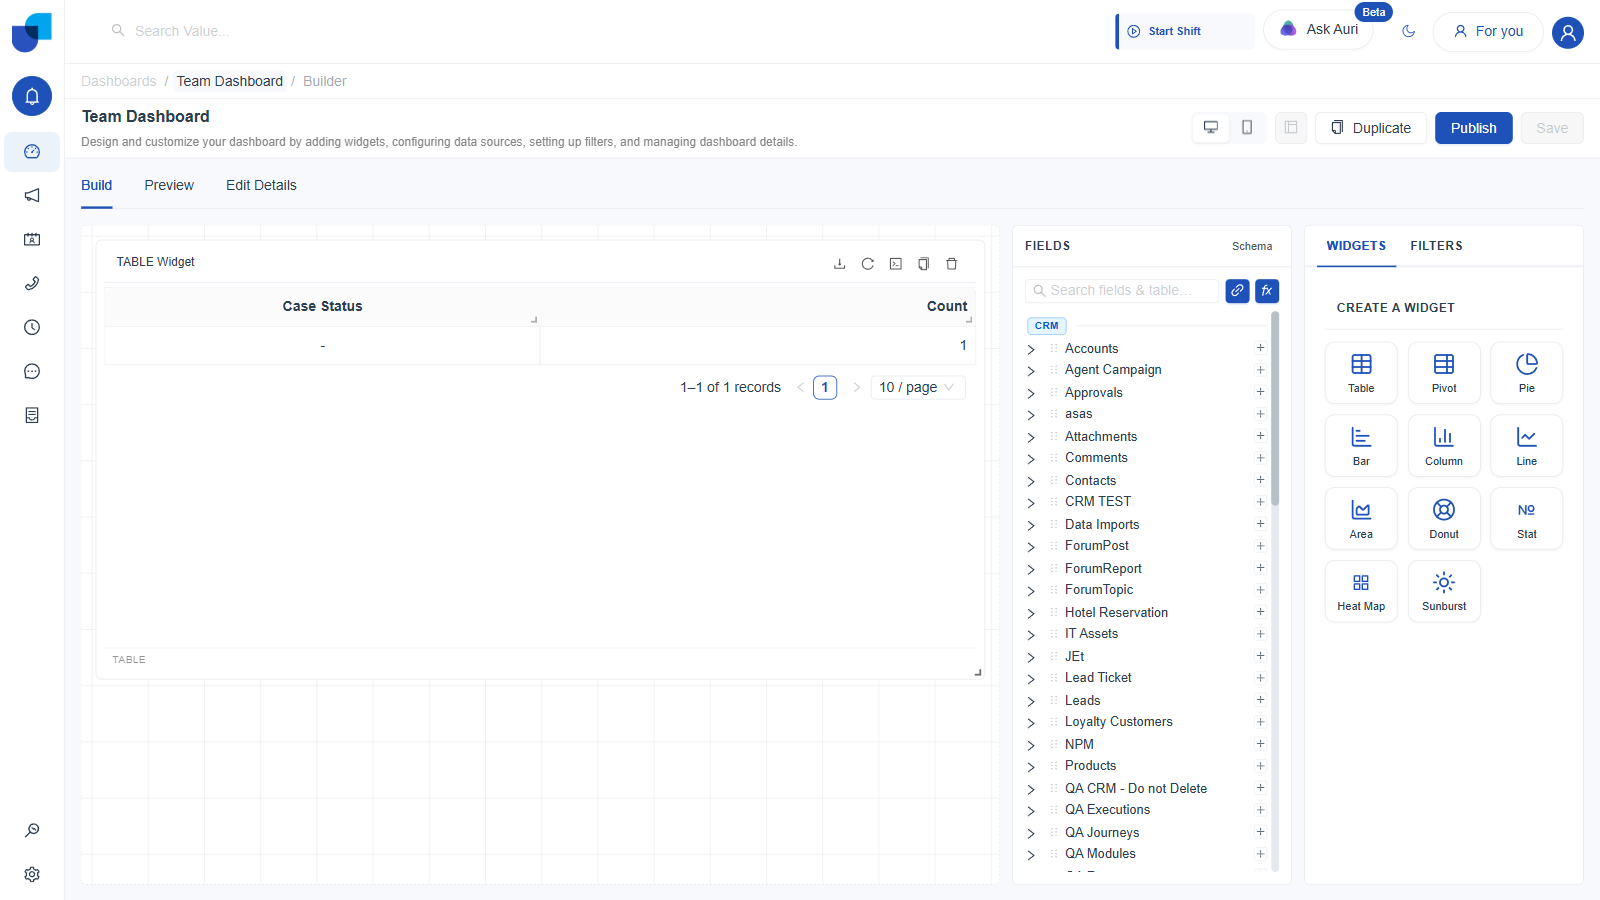
Figure 3. The same widget after dragging Case Status and Count onto Columns. Real data renders immediately.
2. Pivot
A cross tabulation: dimensions spread across two axes, Rows and Columns, with a measure aggregated into each cell, the same shape as a spreadsheet pivot table.
- Click Pivot.
- Set Title and Description.
- Drag one or more dimensions onto Rows.
- Drag one or more dimensions onto Columns.
- Drag one or more measures onto Values.
- Optionally use Filters, Time Configuration, and Sorting, exactly as in a Table widget, and pick a Row Limit up to 10,000, also exactly as in a Table widget.
- Under Display & Summary Options, optionally tick Value Color or Column Color to shade cells, and Summary Column or Summary Row to add a totals column or row.
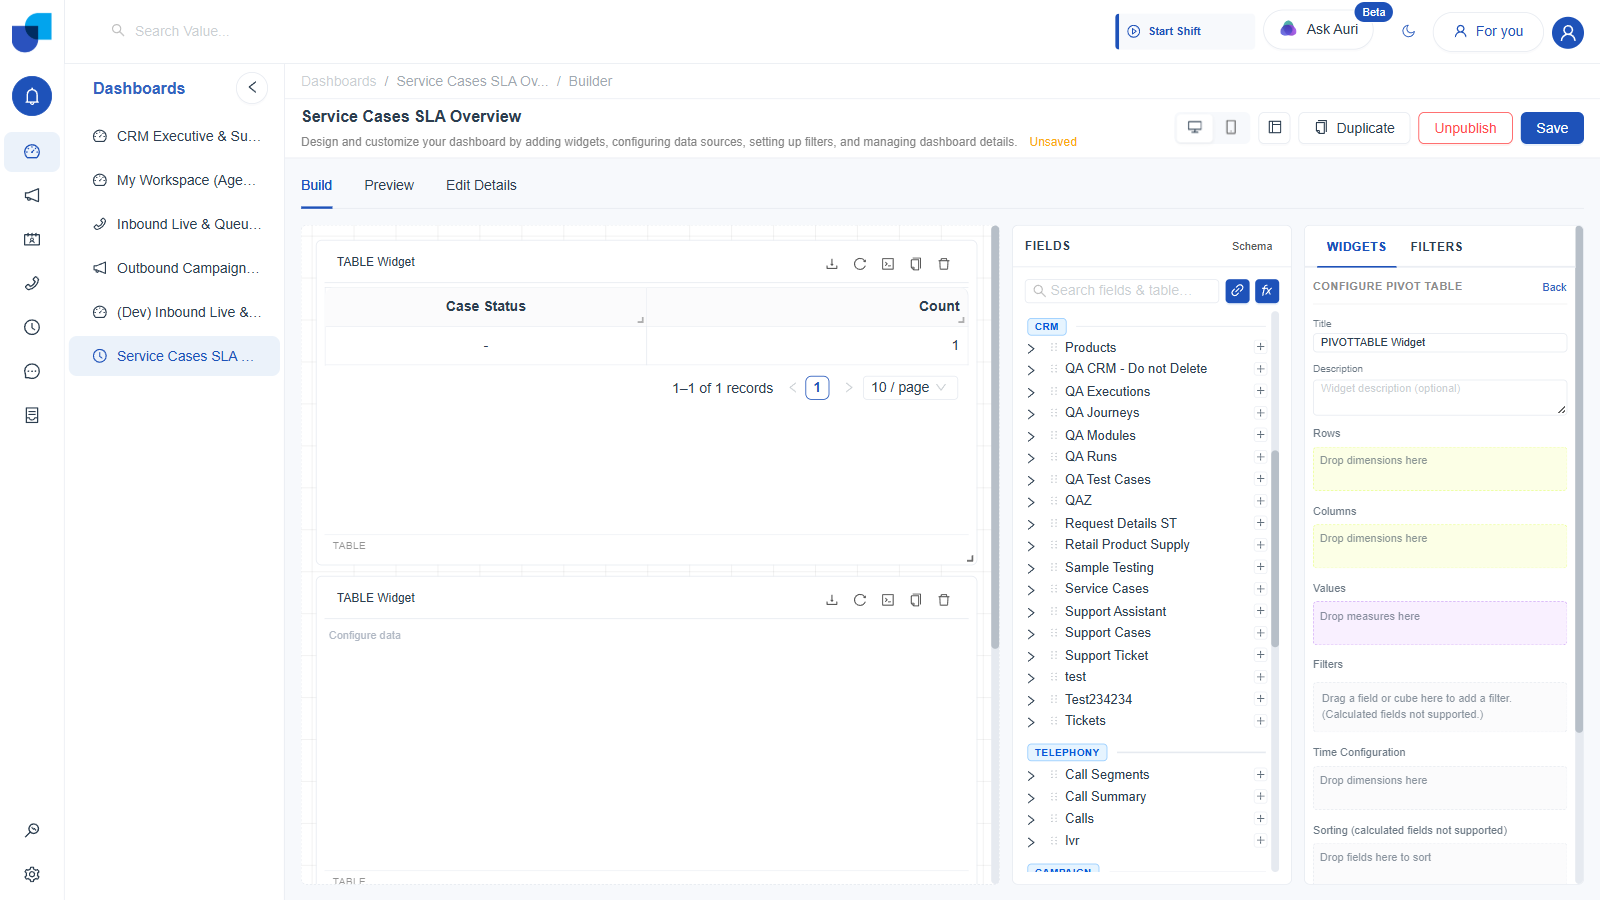
Figure 4. Configure Pivot Table: separate Rows, Columns, and Values drop zones, the same Row Limit control a Table widget has, and a Display & Summary Options section with four checkboxes.
A Pivot's Configure panel has the same Row Limit control as a Table widget, capped at 10,000, not the lower 20 row cap the chart types below use. A Pivot also carries its own Display & Summary Options, found on no other widget type: Value Color and Column Color checkboxes for cell shading, and Summary Column and Summary Row checkboxes for totals.
3. Pie
- Click Pie.
- Set Title and Description.
- Drag one dimension onto Slices (Dimension). Each distinct value becomes one slice.
- Drag one measure onto Values (Measure). This sets each slice's size.
- Optionally use Filters and Sorting, as in a Table widget.
- Pick a Row Limit: 5, 10, 15, 20, or Custom. This caps how many slices are drawn.
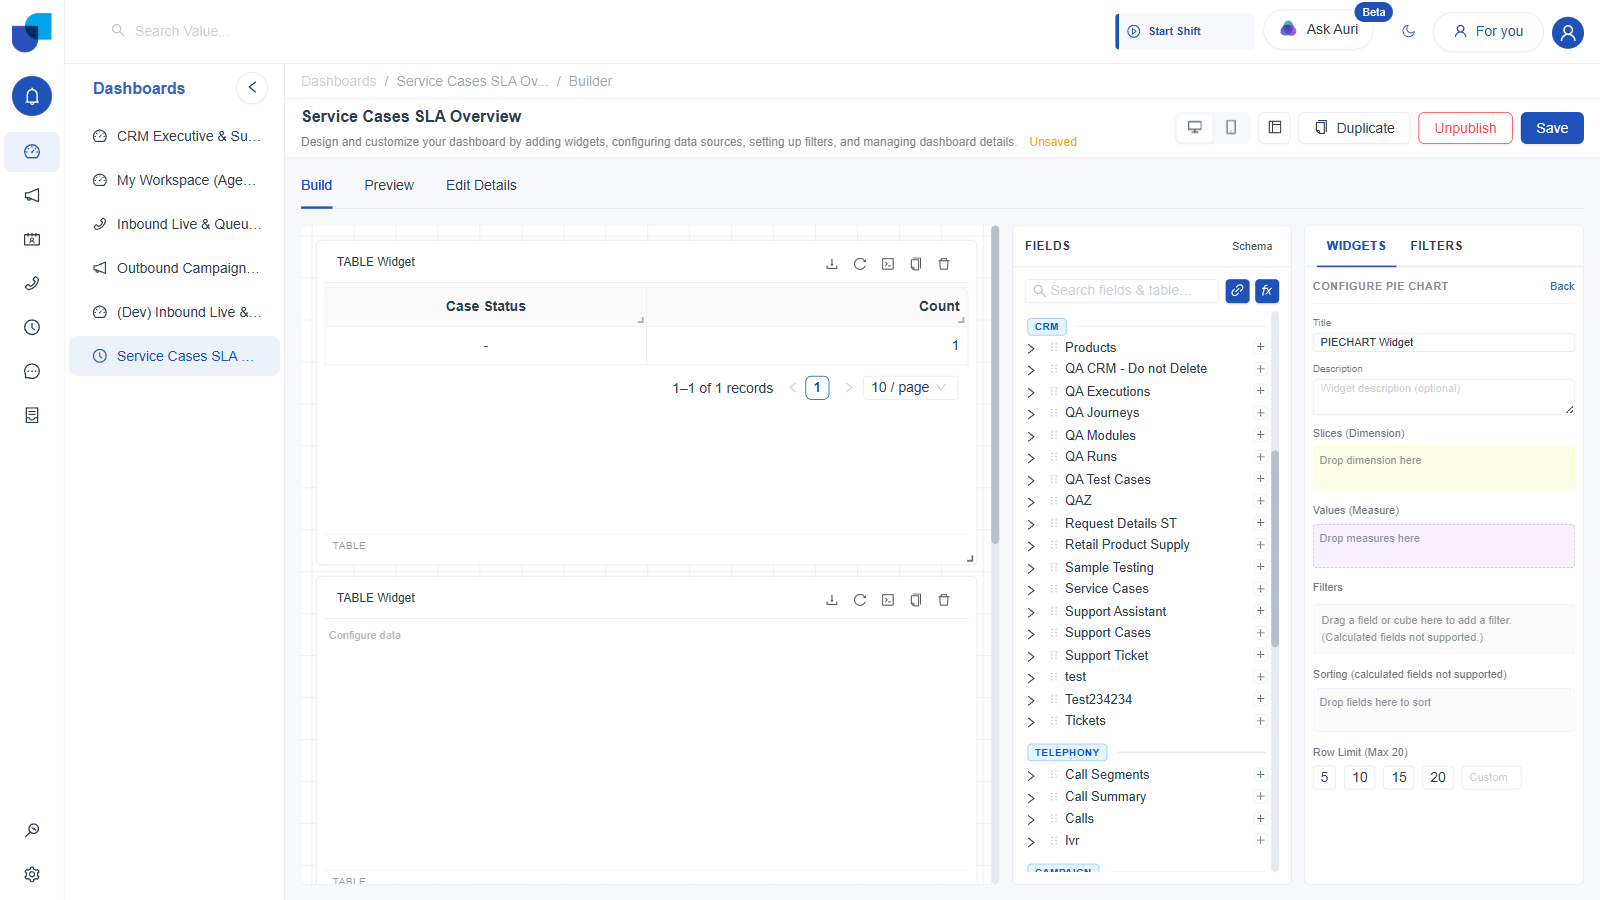
Figure 5. Configure Pie Chart: a single Slices drop zone and a single Values drop zone.
Every chart type from here on, Pie through Sunburst, caps its Row Limit at 20, well below the Table and Pivot widgets' 10,000. A pie, bar, or heat map with more than a handful of categories stops being readable, so the builder keeps the ceiling low on purpose.
4. Bar
Horizontal bars: categories run down the vertical axis, values extend across the horizontal axis.
- Click Bar.
- Set Title and Description.
- Drag a dimension onto Categories (Y-Axis).
- Drag a measure onto Values (X-Axis 1).
- Optionally drag a second dimension onto Split By / Stack (Dimension) to break each category's bar into stacked segments.
- Set a Row Limit, 5 to 20, or Custom, and, further down the panel, an X-Axis Label Angle to rotate long category labels.
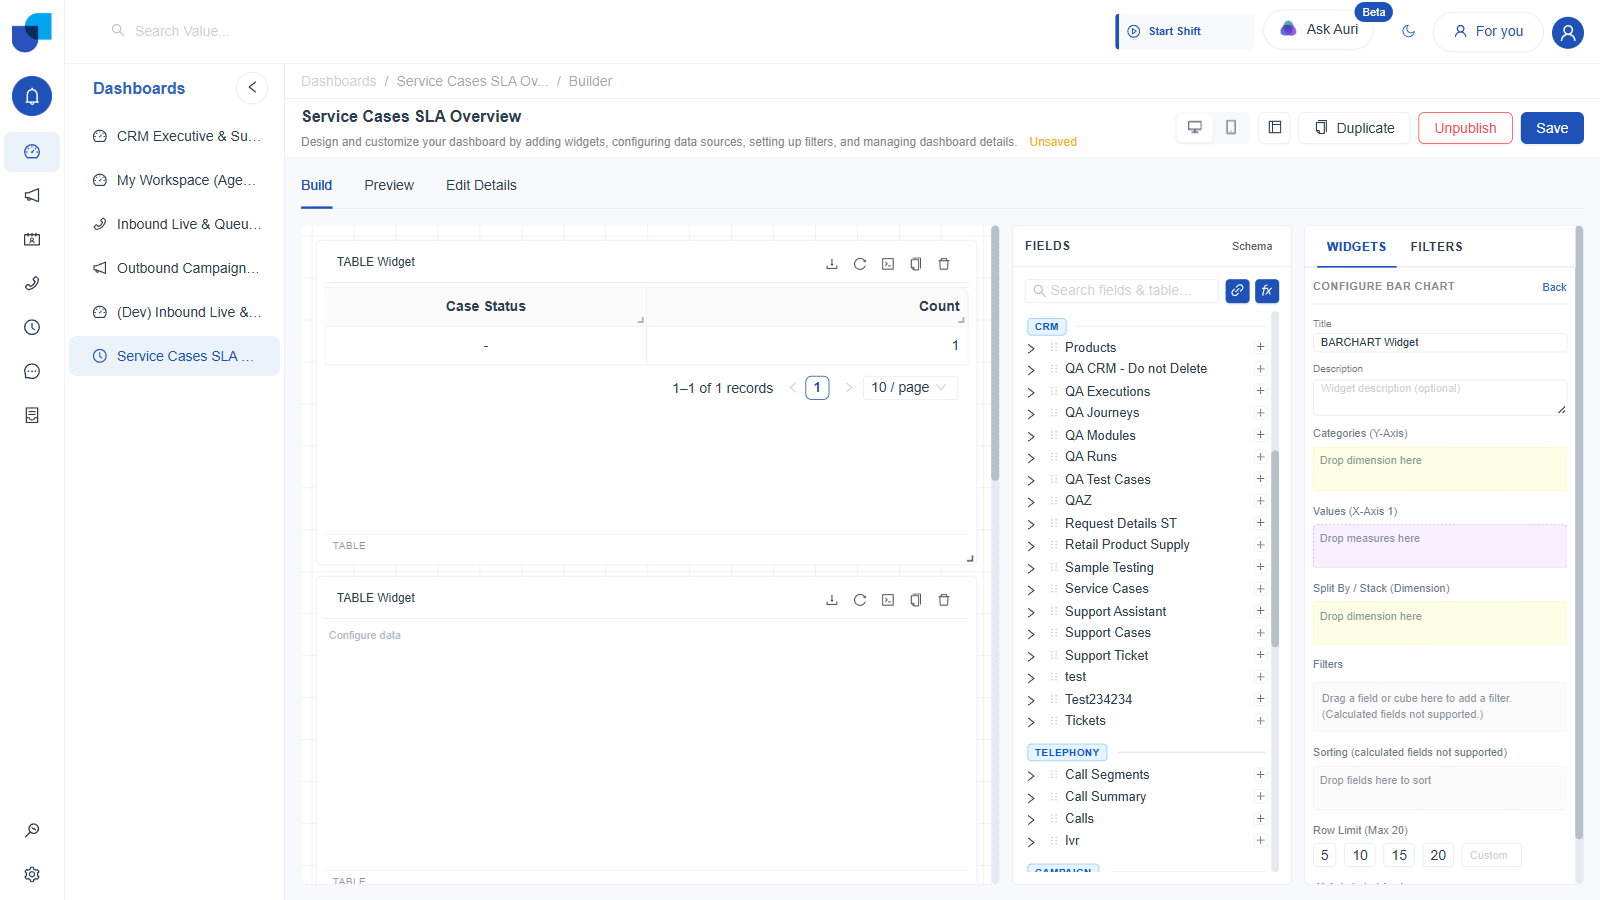
Figure 6. Configure Bar Chart: Categories on the Y-Axis, Values on the X-Axis, an optional Split By / Stack dimension.
5. Column
The vertical counterpart to Bar: categories run across the horizontal axis, values rise up the vertical axis.
- Click Column.
- Drag a dimension onto Categories (X-Axis).
- Drag a measure onto Values (Y-Axis 1).
- Optionally drag a dimension onto Split By / Stack (Dimension) for stacked columns.
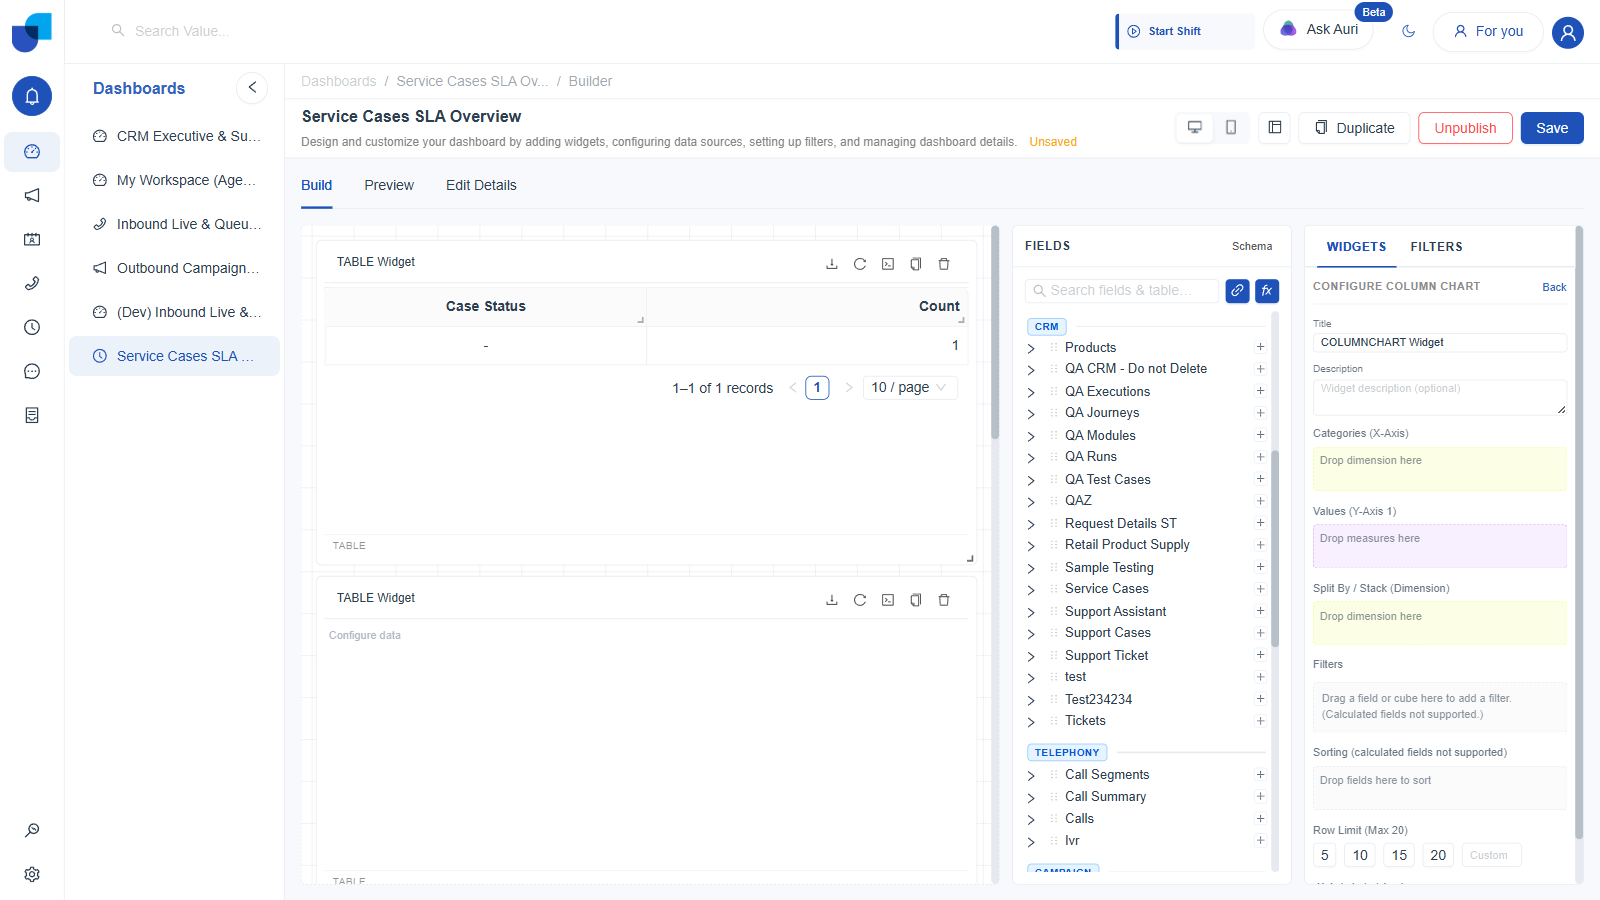
Figure 7. Configure Column Chart: the mirror image of Bar, with axes swapped. Team Dashboard's own Cases by Type widget, Case Type on Categories and Count on Values, uses exactly this layout.
If you are not sure whether a comparison reads better as Bar or Column, pick Column by default. Reserve Bar for when category labels are long enough that they would overlap on a horizontal axis.
6. Line
Built for trends over an ordered dimension, almost always a date or time field.
- Click Line.
- Drag an ordered dimension, typically a date, onto Categories (X-Axis).
- Drag a measure onto Values (Y-Axis 1).
- Optionally drag a dimension onto Split By / Group (Dimension) to draw one line per distinct value, instead of stacking them.
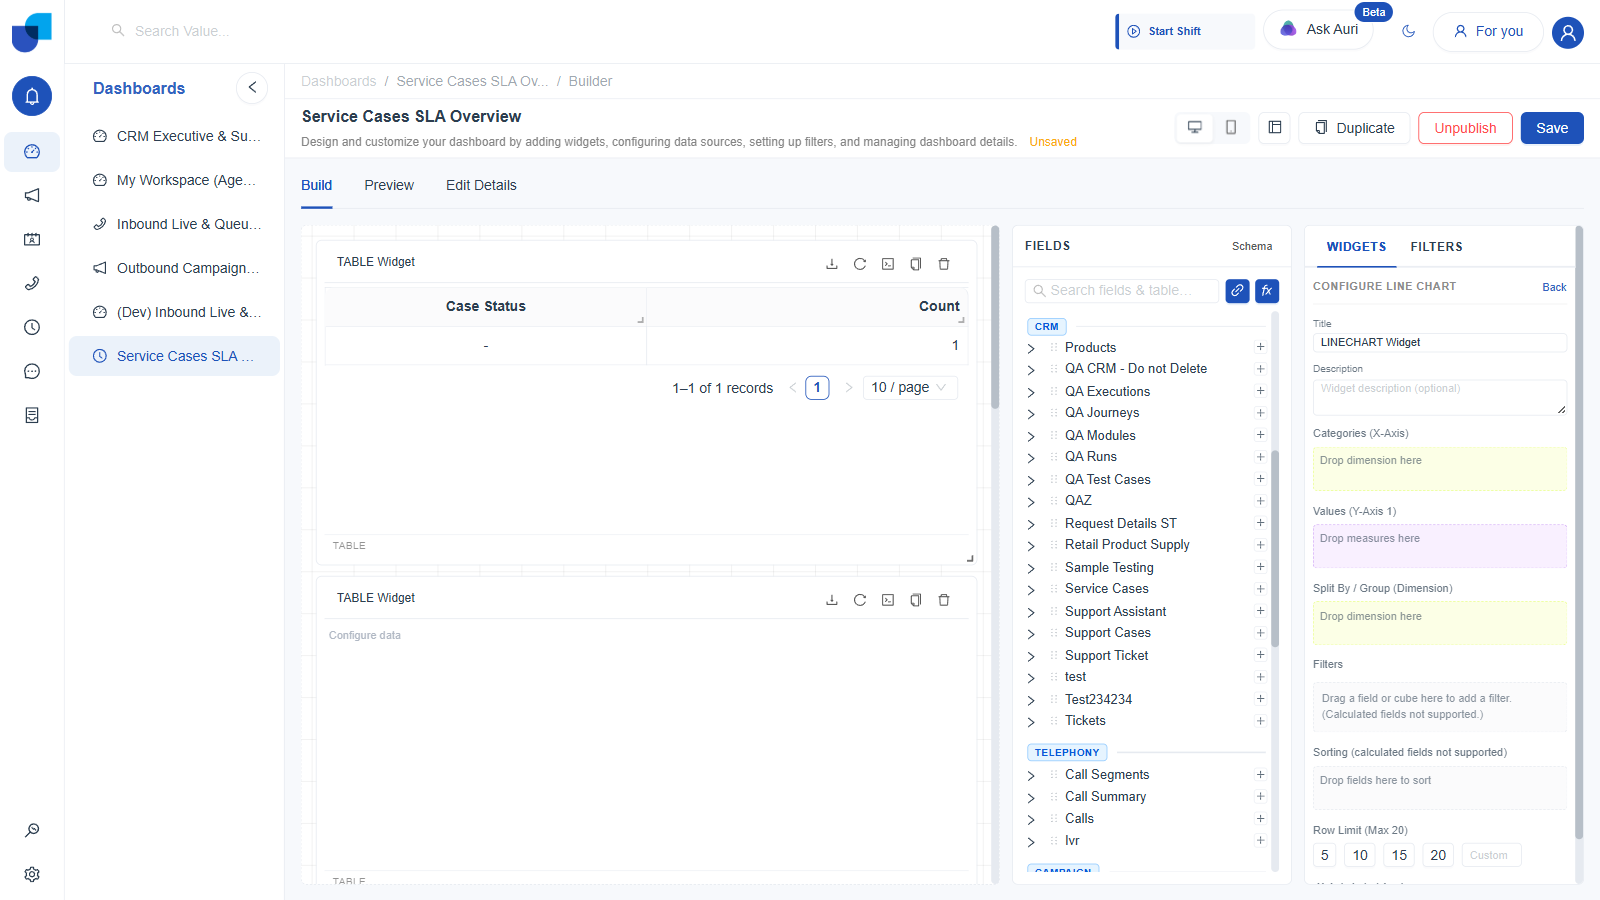
Figure 8. Configure Line Chart. Note the third drop zone reads "Split By / Group," not "Stack," since separate lines are drawn side by side rather than layered.
7. Area
A filled version of Line, sharing Column's exact field layout.
- Click Area.
- Drag a dimension onto Categories (X-Axis).
- Drag a measure onto Values (Y-Axis 1).
- Optionally drag a dimension onto Split By / Stack (Dimension) to layer multiple series as stacked, filled bands.
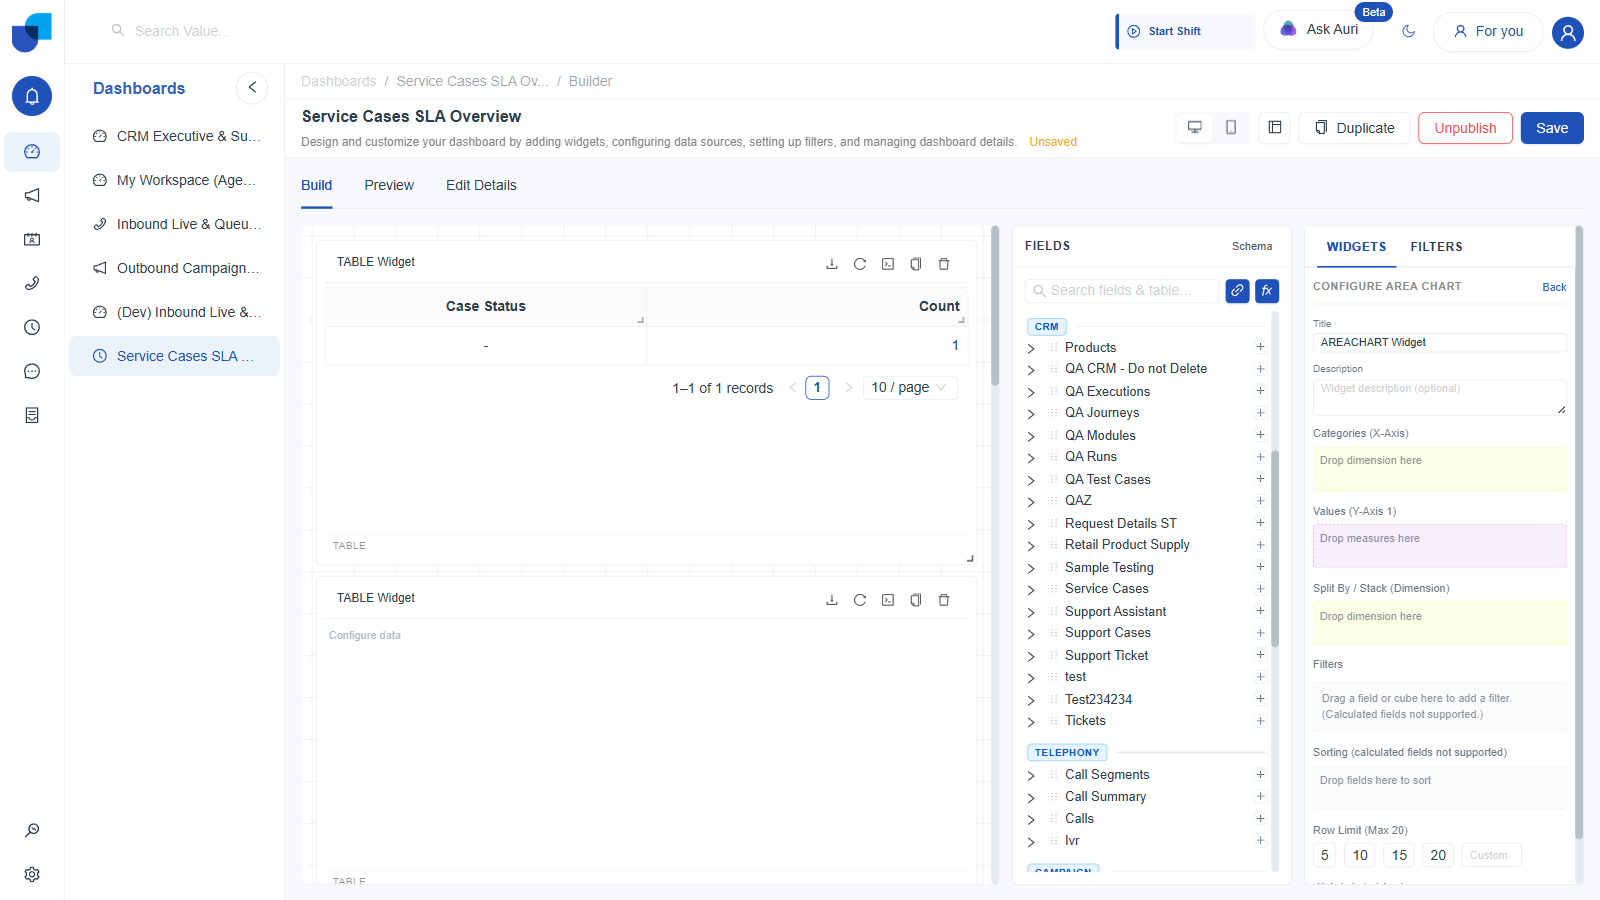
Figure 9. Configure Area Chart, using the Stack label, in contrast to Line's Group label.
8. Donut
Functionally identical to Pie, a ring in place of a full circle.
- Click Donut.
- Drag a dimension onto Slices (Dimension).
- Drag a measure onto Values (Measure).
- Set a Row Limit, 5 to 20, or Custom.
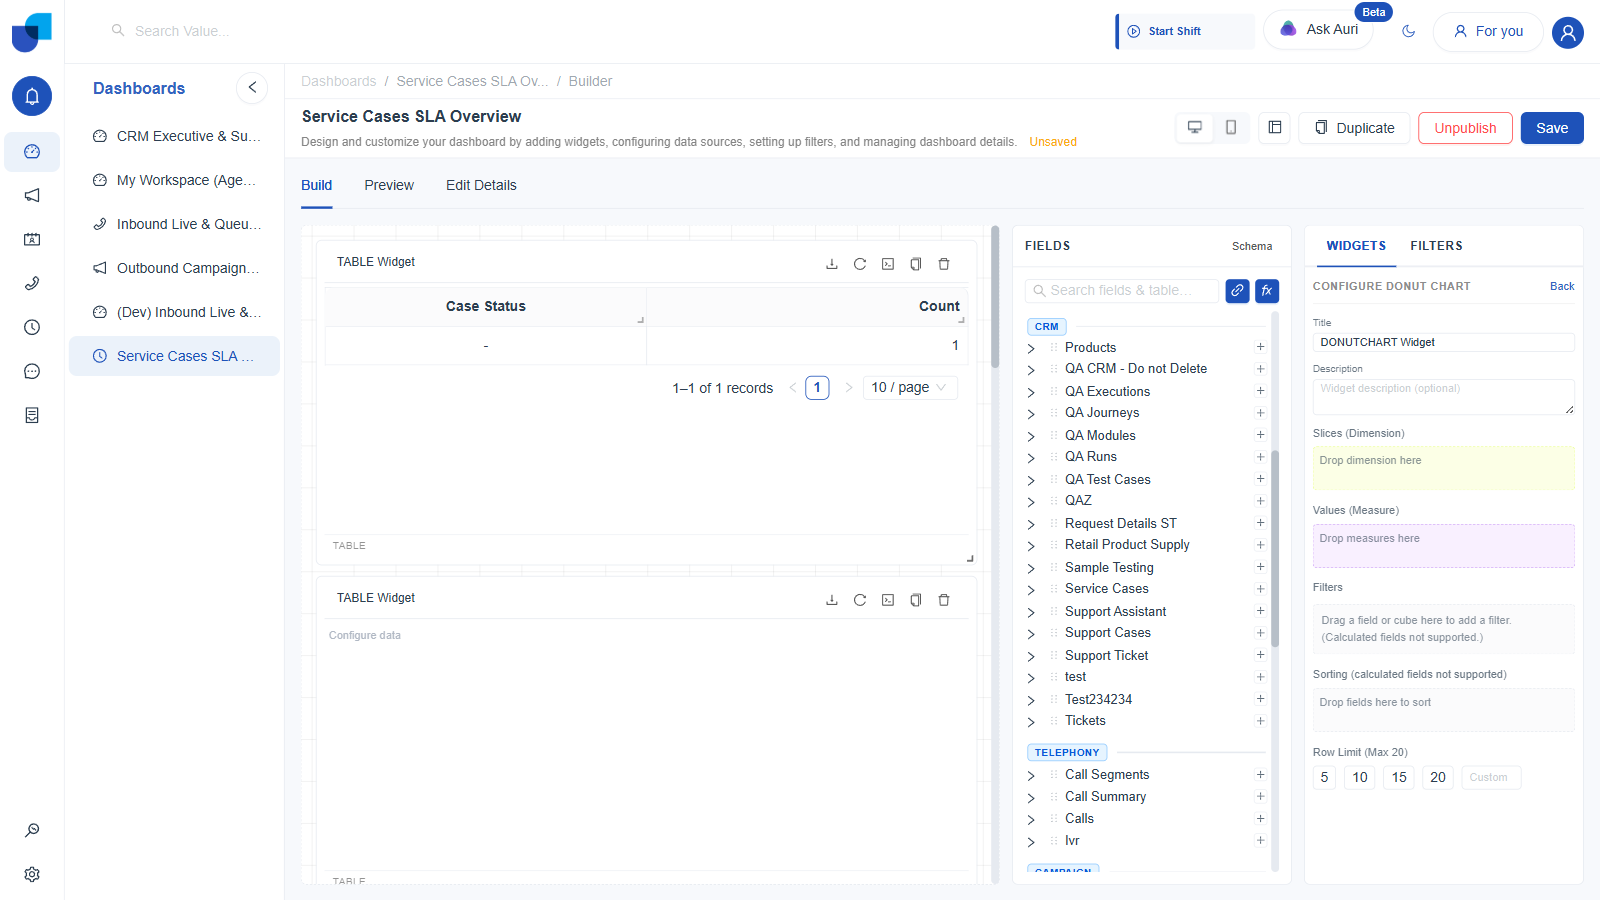
Figure 10. Configure Donut Chart: the same two drop zones as Pie.
9. Stat
A single headline number, built for a screen someone glances at rather than reads in detail.
- Click the Stat button, labeled with a field-number icon.
- Drag a measure onto Values.
- Optionally drag a second measure onto Secondary Measure (optional), commonly used for a comparison figure shown alongside the primary number.
- Optionally use Filters, as in a Table widget.
- Choose a Value Type to control how the number is formatted.
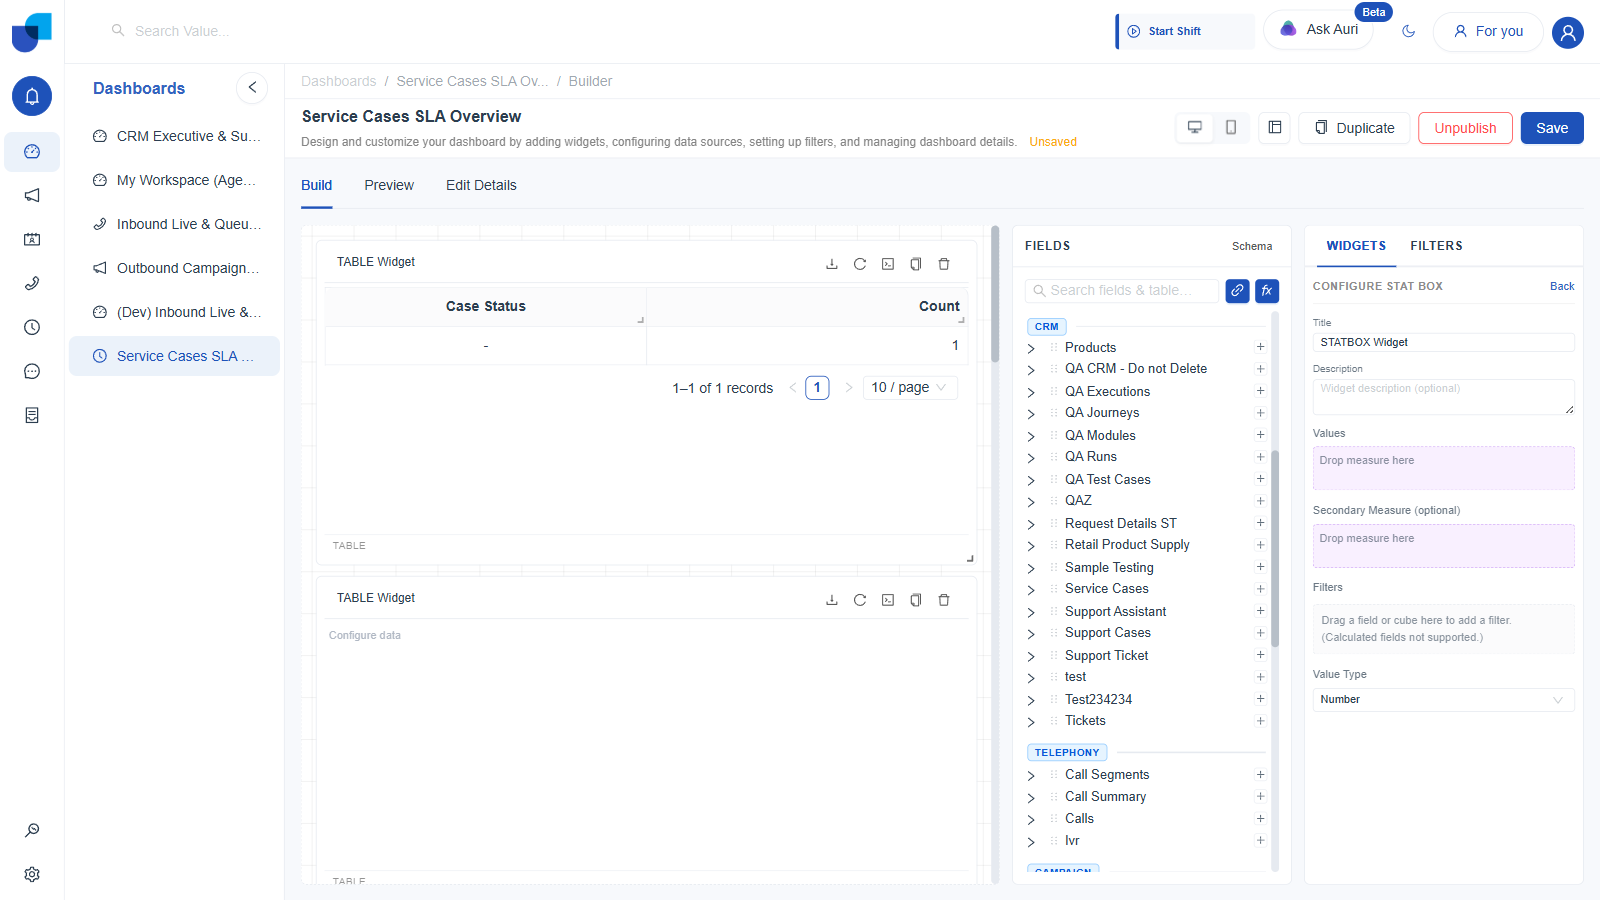
Figure 11. Configure Stat Box: Values, an optional Secondary Measure, a Filters drop zone, and a Value Type selector. No Row Limit and no Sorting control appear anywhere in this panel.
| Value Type Option | Use For |
|---|---|
| Number | A plain count or sum, the default. |
| Percentage (%) | A ratio already expressed as a fraction, rendered with a percent sign. |
| String / Text | A measure whose result is a label rather than a quantity. |
| Time Duration (s → h m s) | A duration stored in seconds, rendered as hours, minutes, and seconds. |
| Time Duration (HH:MM:SS) | The same kind of duration, rendered as a clock style string instead. |
| Live Ticker ((hh:)mm:ss) | A duration that keeps counting up in the browser between refreshes, for an in progress timer. |
Unlike every other widget type, Stat has no Row Limit and no Sorting control in its Configure panel. It only ever shows one value, plus one optional secondary value, so neither setting applies.
10. Heat Map
A grid of two dimensions, with a measure setting each cell's color intensity.
- Click the Heat Map button, labeled with an appstore icon.
- Drag a dimension onto X Axis (Dimension).
- Drag a second dimension onto Y Axis (Dimension).
- Drag a measure onto Values (Measure).
- Optionally use Filters and Sorting, as in a Table widget.
- Set a Row Limit, 5 to 20, or Custom.
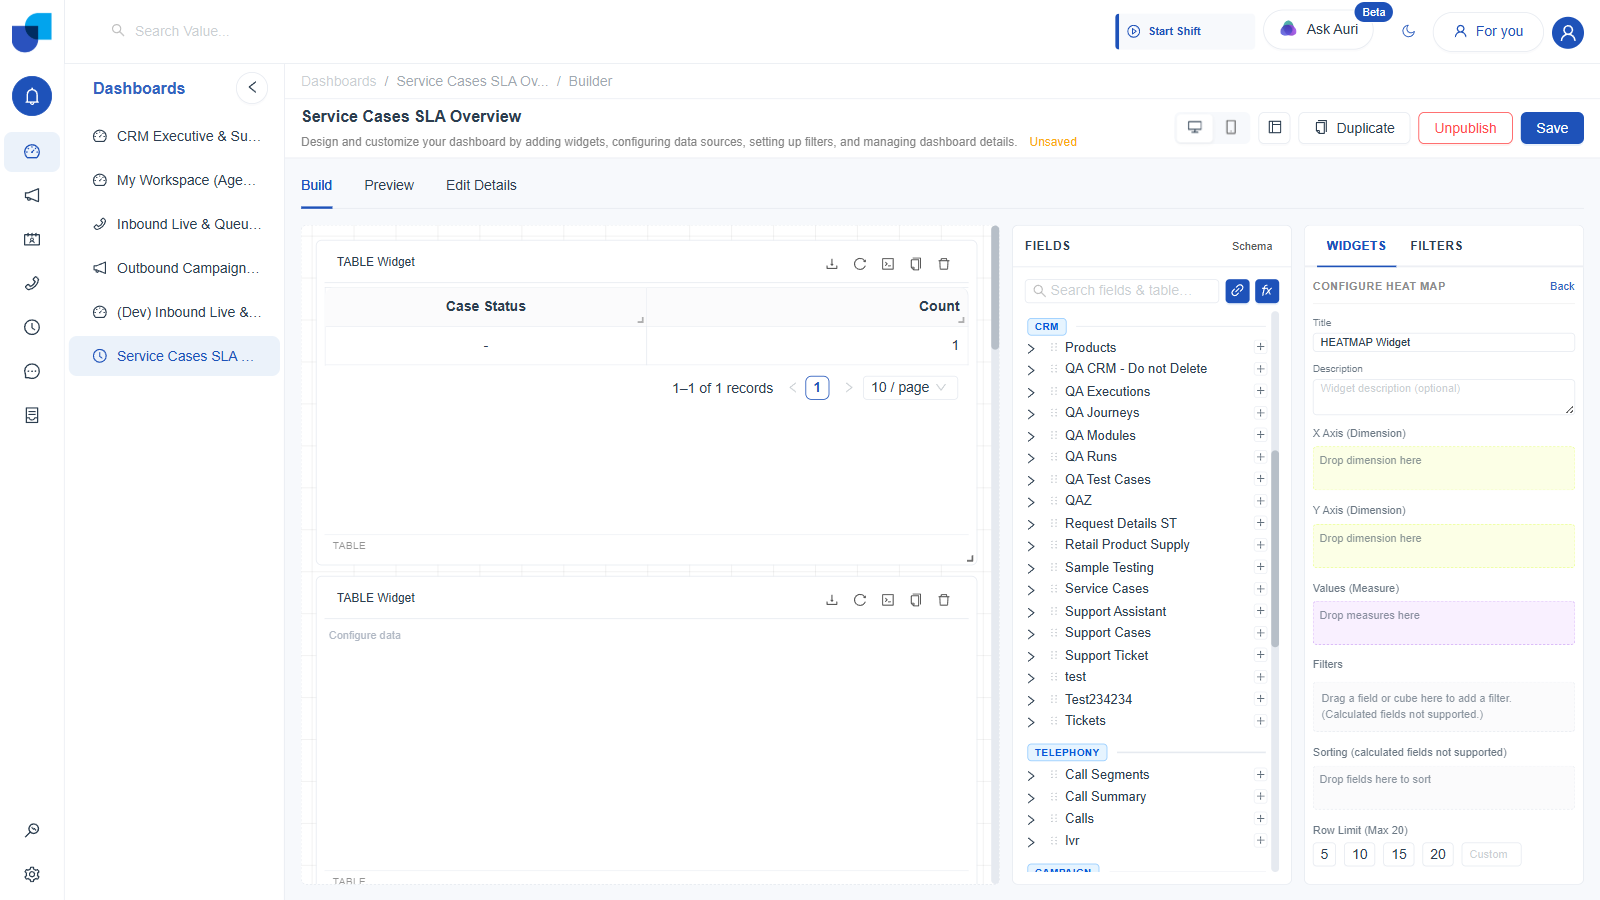
Figure 12. Configure Heat Map: two separate dimension axes plus one measure for cell intensity.
Good candidates for the two axes are a time bucket, hour of day or day of week, on one axis and a categorical field, agent, service line, or queue, on the other, with Count or a duration measure driving color.
11. Sunburst
A nested, ring within ring breakdown, the only type built explicitly for hierarchical data.
- Click Sunburst.
- Drag two or more dimensions onto Hierarchy, in the order you want the rings to nest, outermost first.
- Drag a measure onto Values. This sets each segment's size.
- Optionally use Filters and Sorting, as in a Table widget.
- Set a Row Limit, 5 to 20, or Custom.
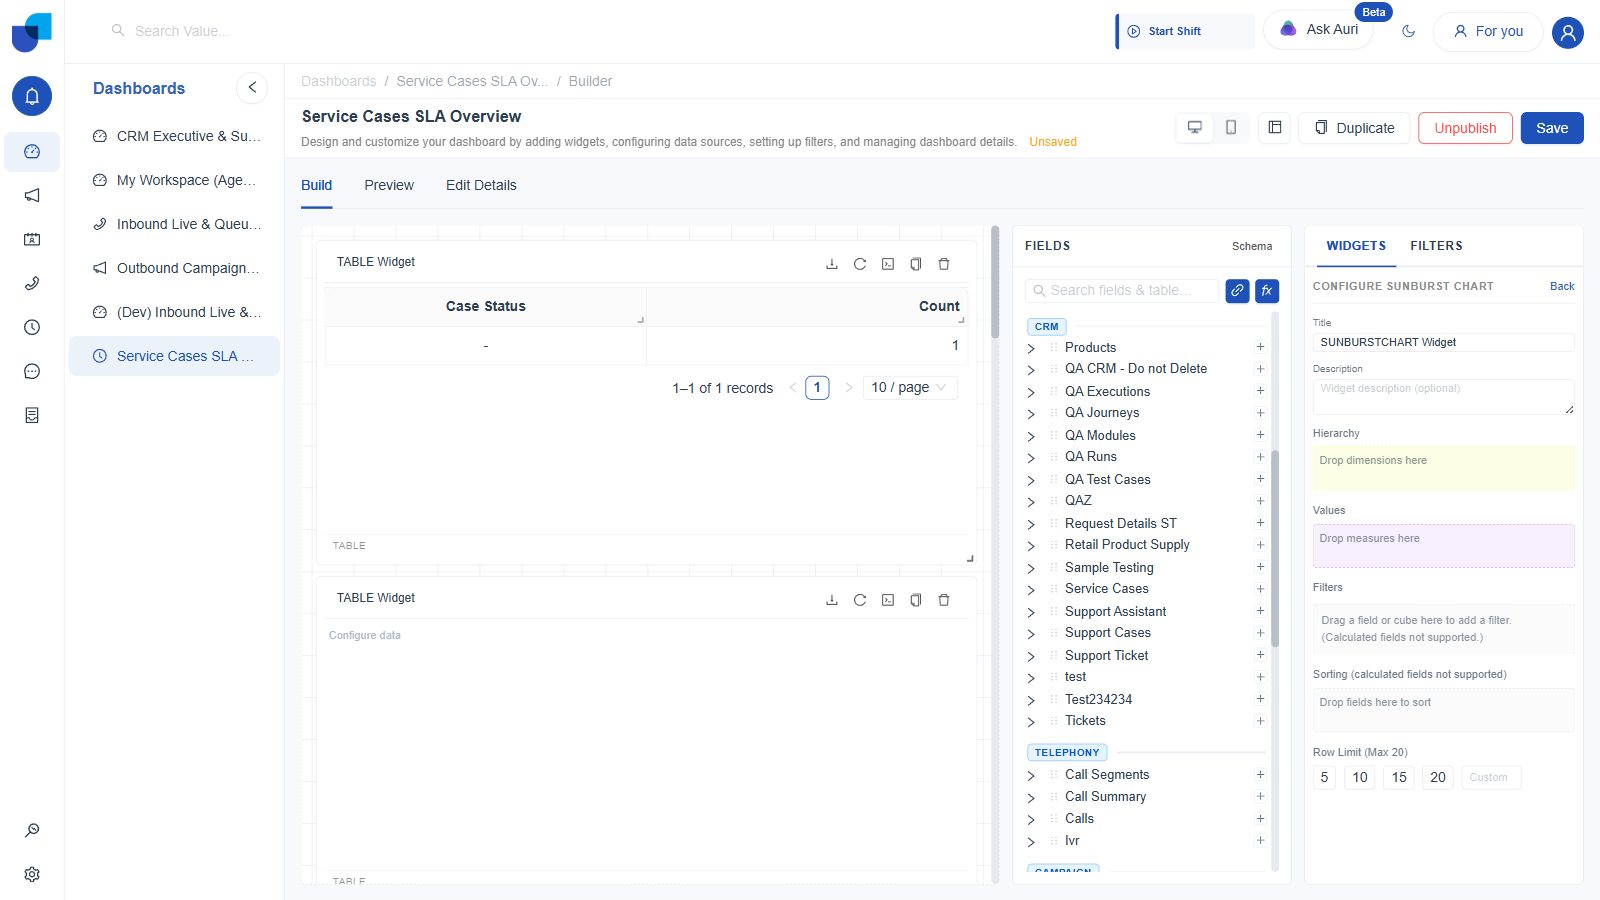
Figure 13. Configure Sunburst Chart: a single Hierarchy drop zone that accepts multiple dimensions.
Hierarchy is the only drop zone across all eleven widget types that is explicitly designed to take more than one dimension and treat their order as meaningful. In every other type, dropping a second dimension onto a single field zone replaces the first one instead of nesting it.
Choosing a Type for the Job
| Question | Lean Toward |
|---|---|
| Need exact, row-level detail someone can scan or export | Table |
| Need a spreadsheet style cross tabulation of two dimensions, with totals | Pivot |
| Comparing a handful of categories' share of a whole | Pie or Donut |
| Comparing categories by magnitude, with long labels | Bar |
| Comparing categories by magnitude, with short labels | Column |
| Showing a trend over time, one or more series side by side | Line |
| Showing a trend over time as a filled, stacked band | Area |
| One headline number for a screen someone glances at | Stat |
| Density across two categorical axes at once | Heat Map |
| A nested category breakdown, such as service line into case type | Sunburst |