How to Configure the Use Case in Uniconnect AI
Every click behind the Use Case Scenario: building the Service Cases SLA Overview dashboard with four widgets and a global filter, then the matching SLA Breach Report with two widgets and its own global filter.
Part 1: Create the Dashboard
- Open Dashboards, then click Create.
- Title:
Service Cases SLA Overview - Description:
Tracks open Service Cases, their age, and SLA breaches across all four service lines. - Icon: search "clock," select
ClockCircleOutlined. - Click Save. This lands on the Builder, Build tab, empty canvas.
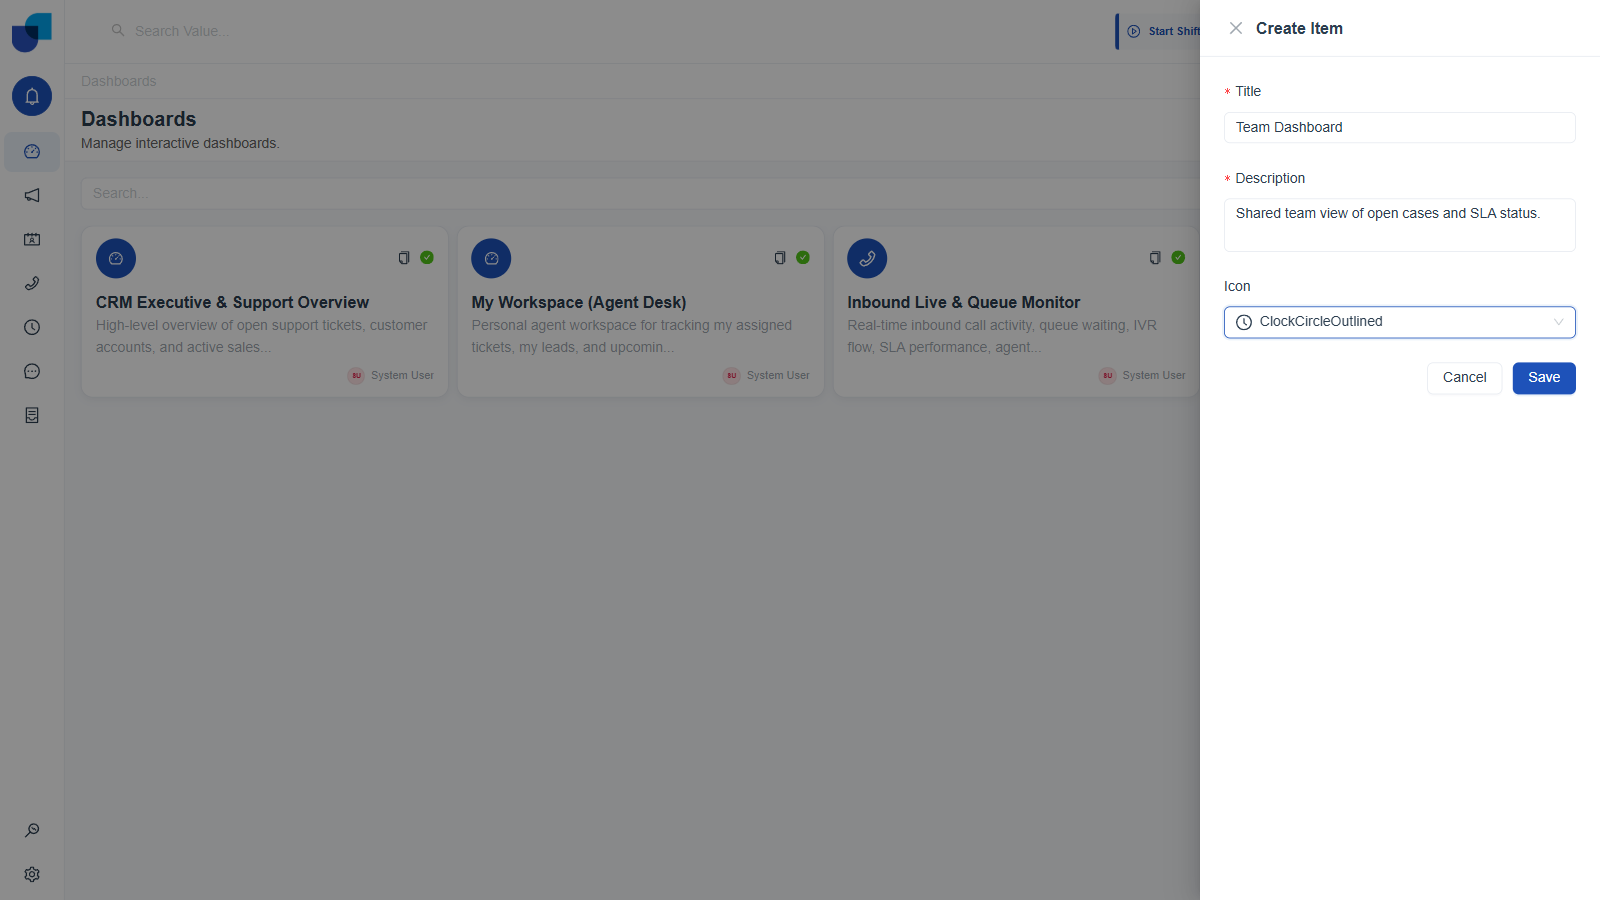
Figure 1. Create Item dialog, filled in and ready to save.
Widget 1: Table, Case Status and Count
- Click Table in the WIDGETS panel.
- In FIELDS, expand Service Cases.
- Drag Case Status onto Columns.
- Drag Count onto Columns, after Case Status.
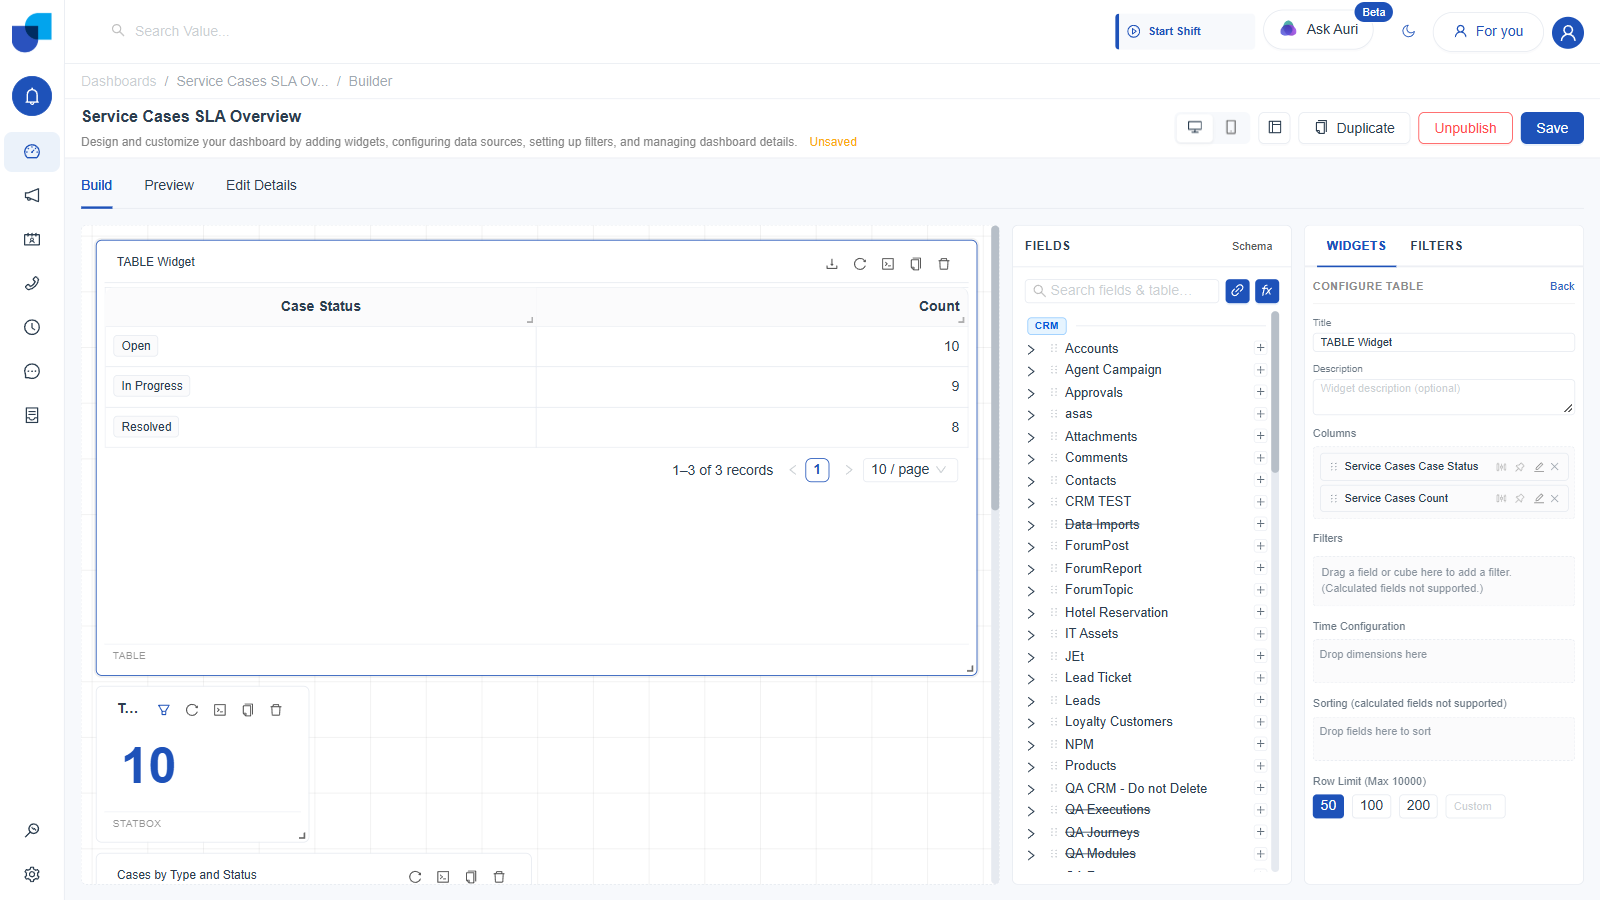
Figure 2. Table widget: ten Open, nine In Progress, eight Resolved, twenty seven cases in total.
Widget 2: Stat, Total Open Cases
- Click Stat in the WIDGETS panel.
- Rename the Title to
Total Open Cases. - Drag Count onto Values.
- Drag Case Status onto Filters, and set it to Open.
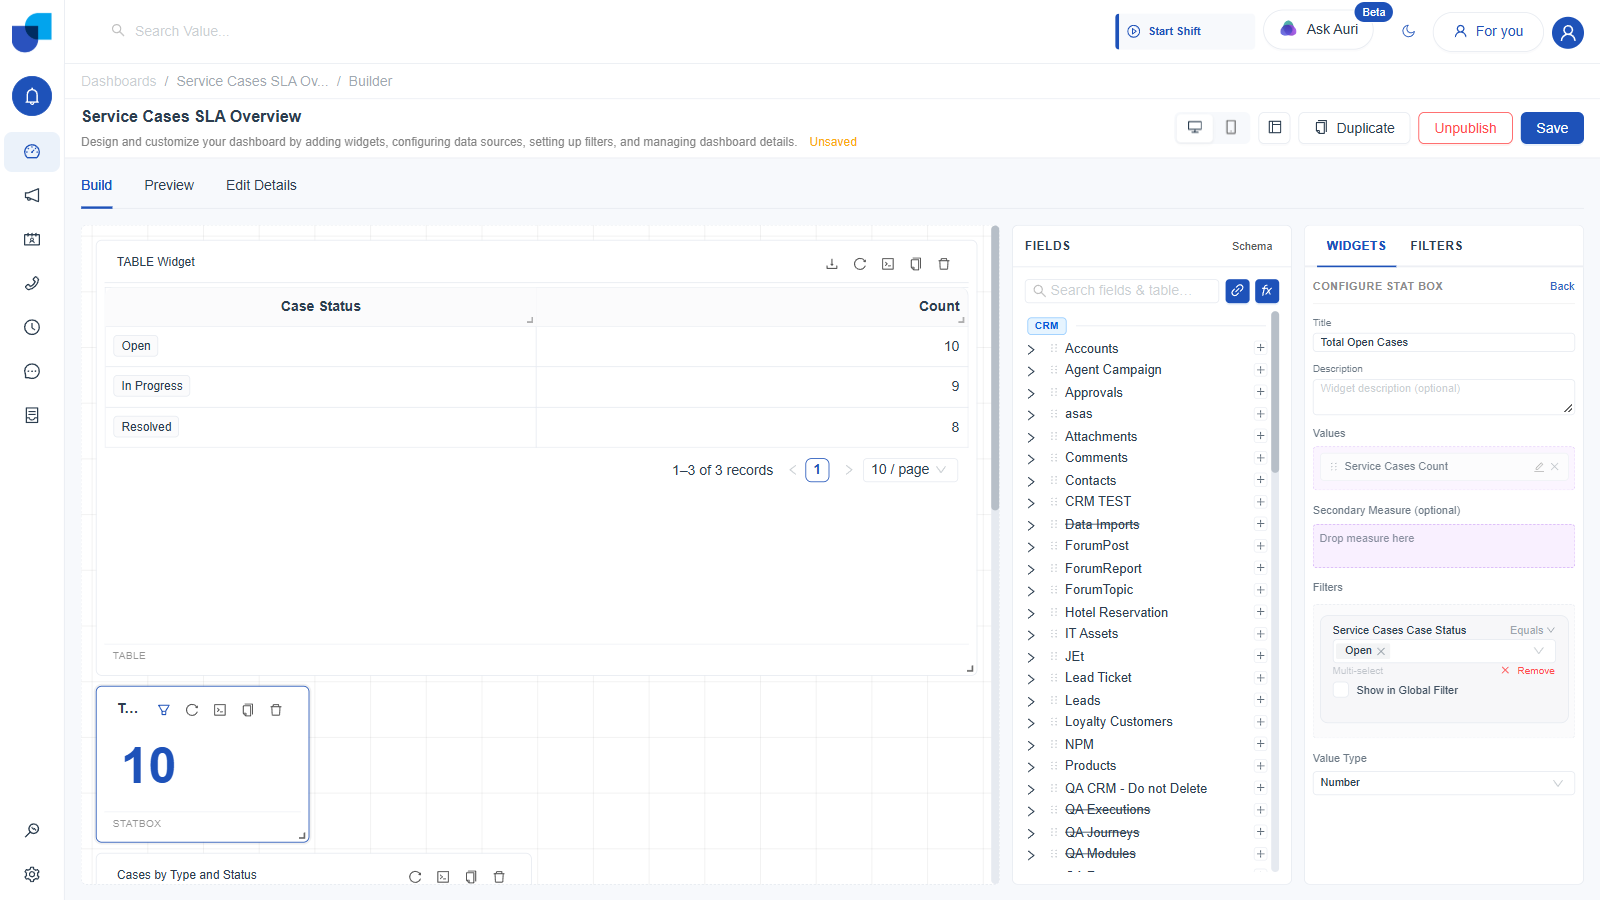
Figure 3. Stat widget: Total Open Cases, filtered to Open, showing 10. This is also the widget used in the next section to build the dashboard's global filter.
Widget 3: Column, Cases by Type and Status
- Click Column in the WIDGETS panel.
- Drag Case Type onto Categories.
- Drag Count onto Values.
- Drag Case Status onto Split By / Stack, so each service line's bar breaks down by status.
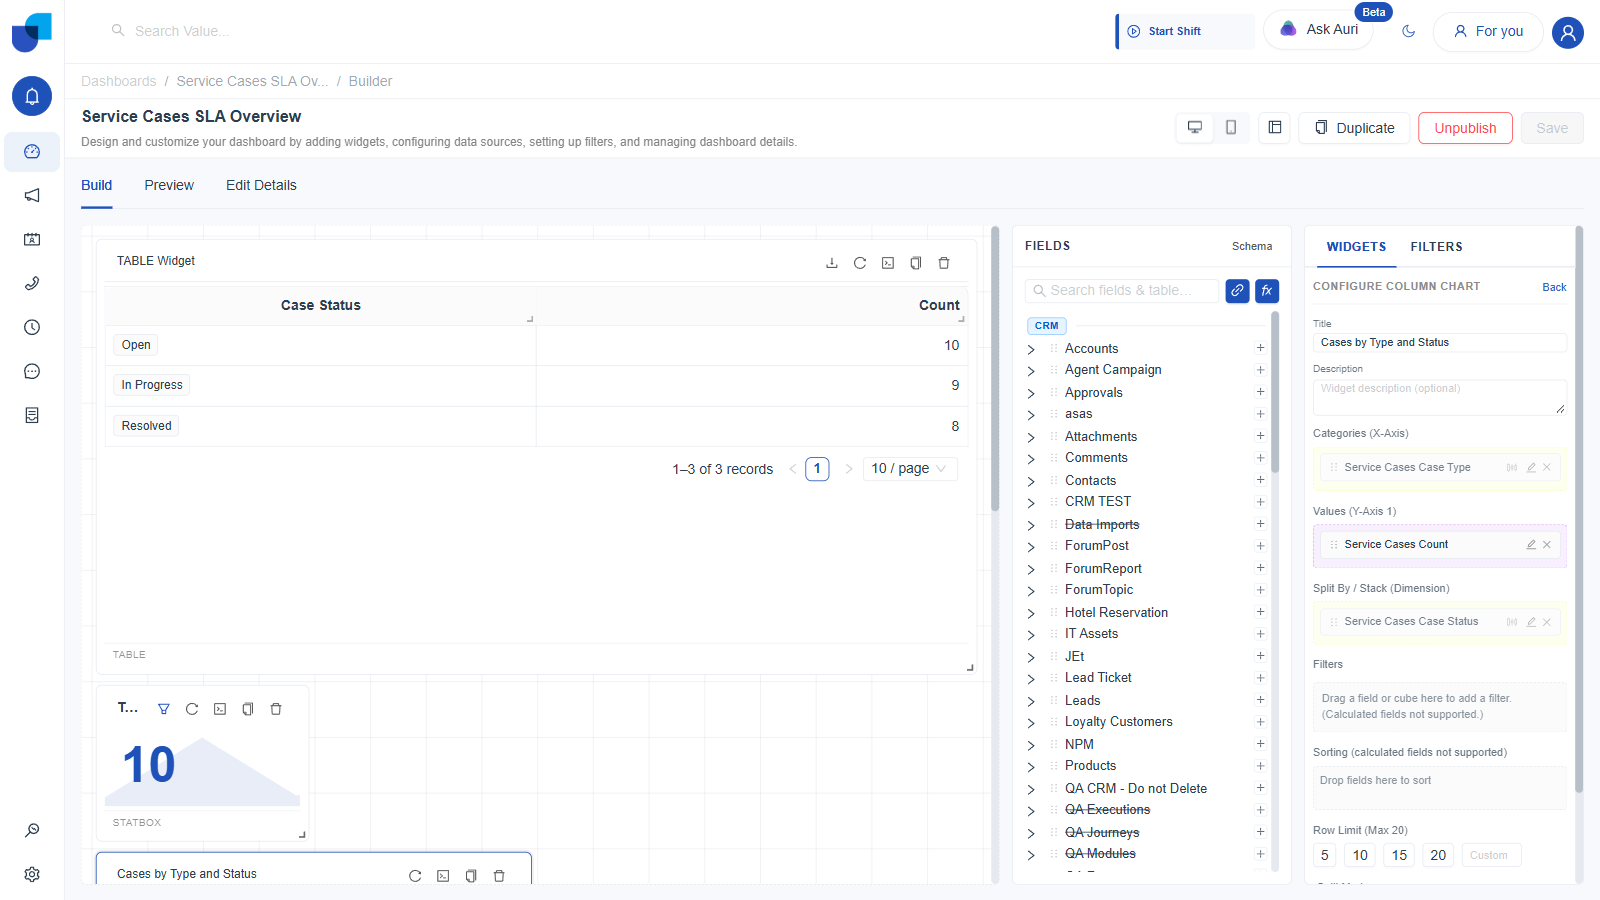
Figure 4. Column widget: Case Type by Count, stacked by Case Status, saved.
Widget 4: Pie, Cases by Reason
- Click Pie in the WIDGETS panel.
- Drag Case Reason onto Slices.
- Drag Count onto Values.
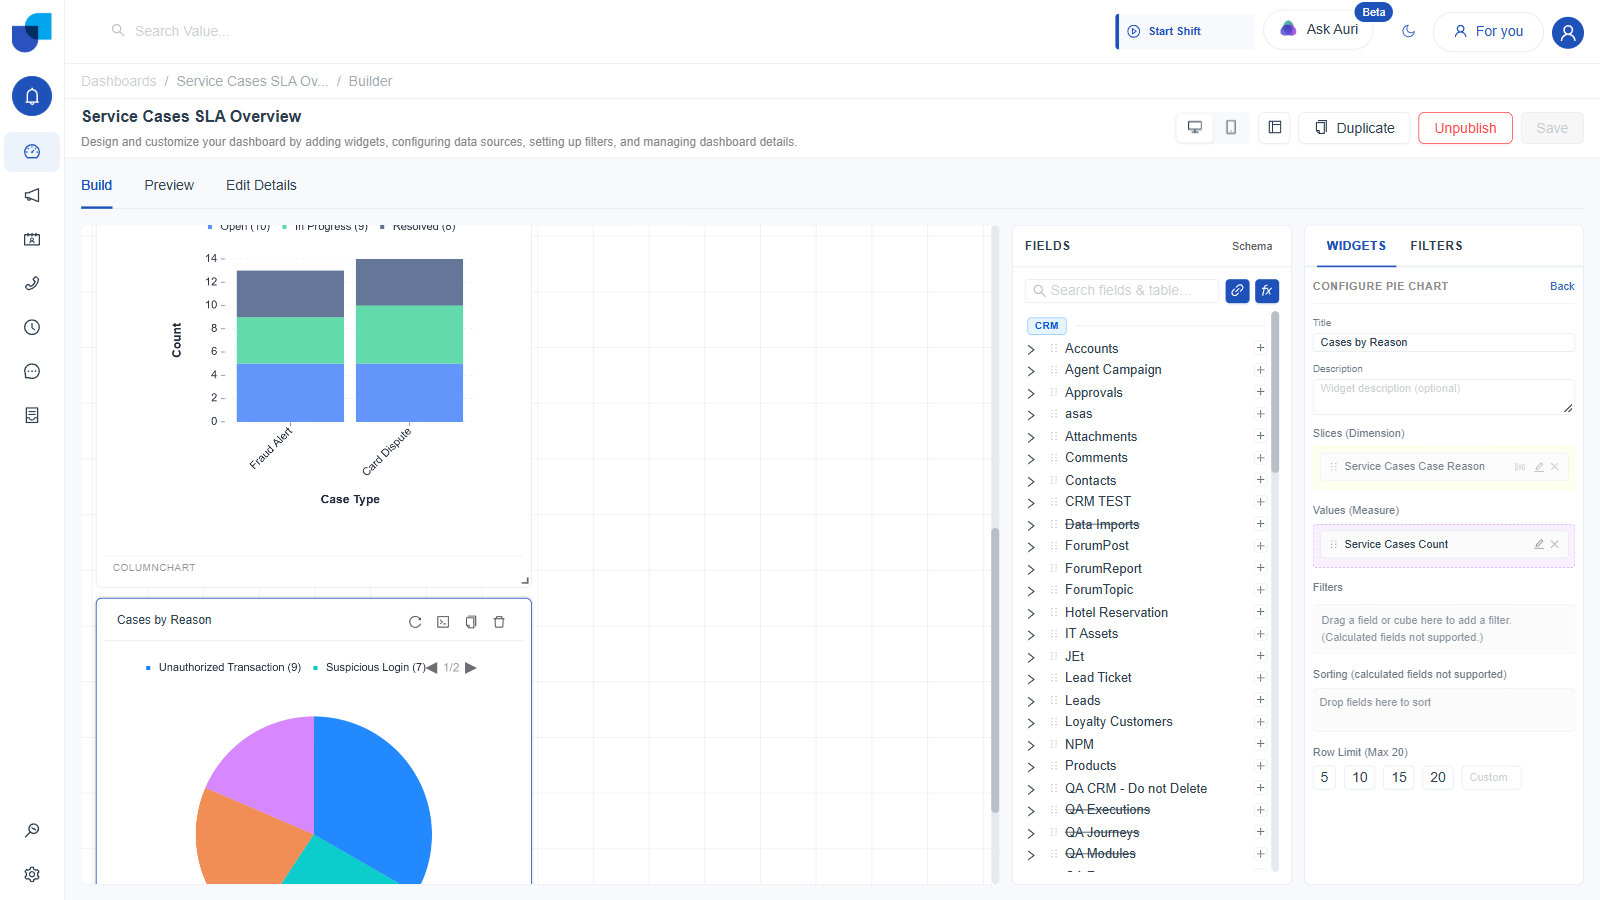
Figure 5. Pie widget: Case Reason by Count, saved.
Case Reason was used for the Pie slices rather than Assigned Agent on purpose. Assigned Agent has no Association back to Contacts, so dragging it into a widget returns a raw numeric id instead of a name. See Data Fields & Schema for the full explanation.
Adding a Global Filter to the Dashboard
A filter dragged onto one widget's own Filters zone only scopes that widget. Turning it into a dashboard wide control is a separate, explicit step performed from inside that same widget.
- With the Total Open Cases Stat widget selected, and its Case Status filter already set to Open, tick the Show in Global Filter checkbox that sits directly beneath the filter's value picker.
- Ticking it immediately clears and locks the widget's own value field, replacing it with
Editable from Global Filters only, and the Stat's own number jumps from 10 back up to 27, the full unfiltered total, until a value is set globally.
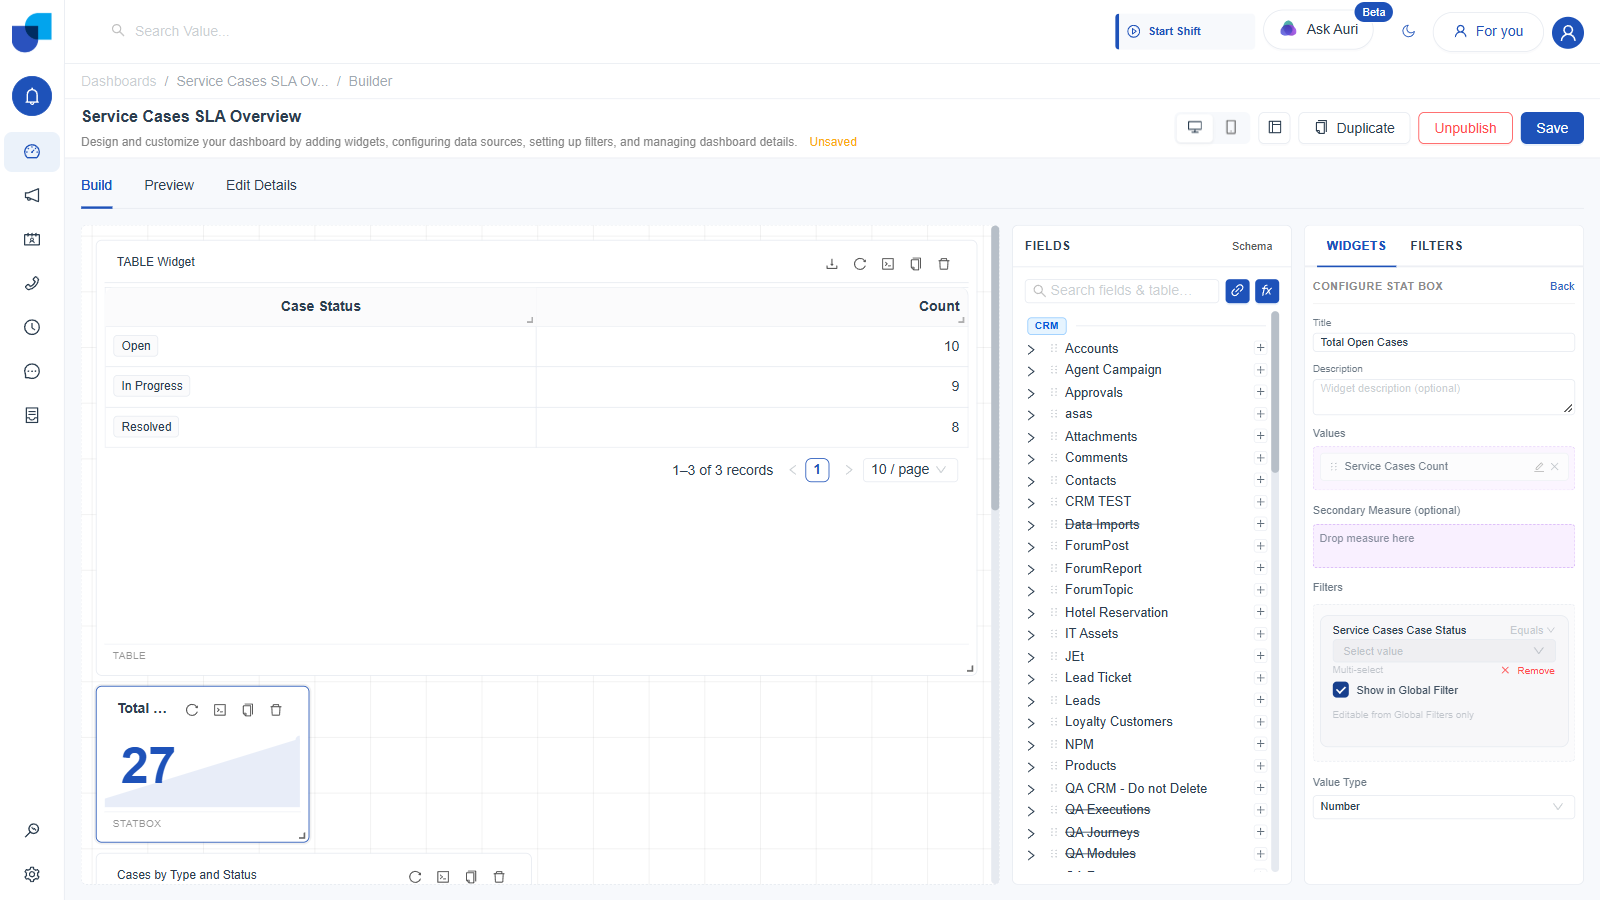
Figure 6. Show in Global Filter, ticked: the widget's own value locks, and the Stat reverts to the unfiltered total, 27, until the global value is set.
- Click the FILTERS tab, next to WIDGETS. The promoted filter now appears here as its own row, with Mandatory and Set Default checkboxes alongside it.
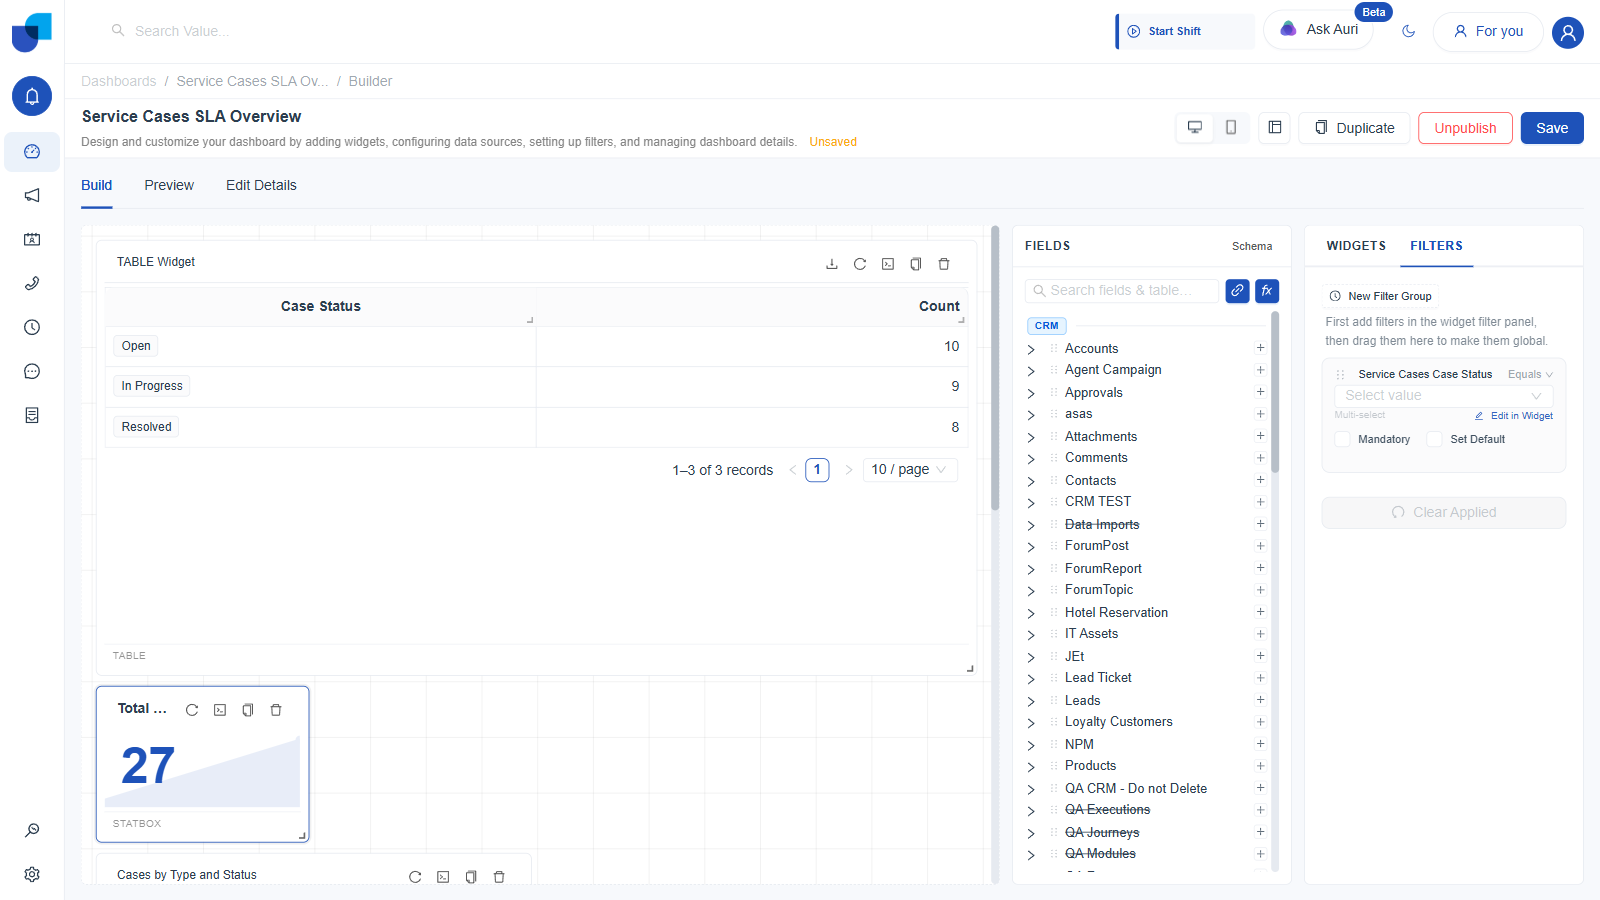
Figure 7. The FILTERS tab: the promoted filter, with its own Mandatory and Set Default checkboxes, before a value is chosen.
- Click the value picker and choose Open.
- Tick Set Default, so the dashboard opens with this value already applied for every viewer, rather than starting unfiltered.
- Click Generate Report to apply the filter immediately inside the Builder and confirm it against live data.
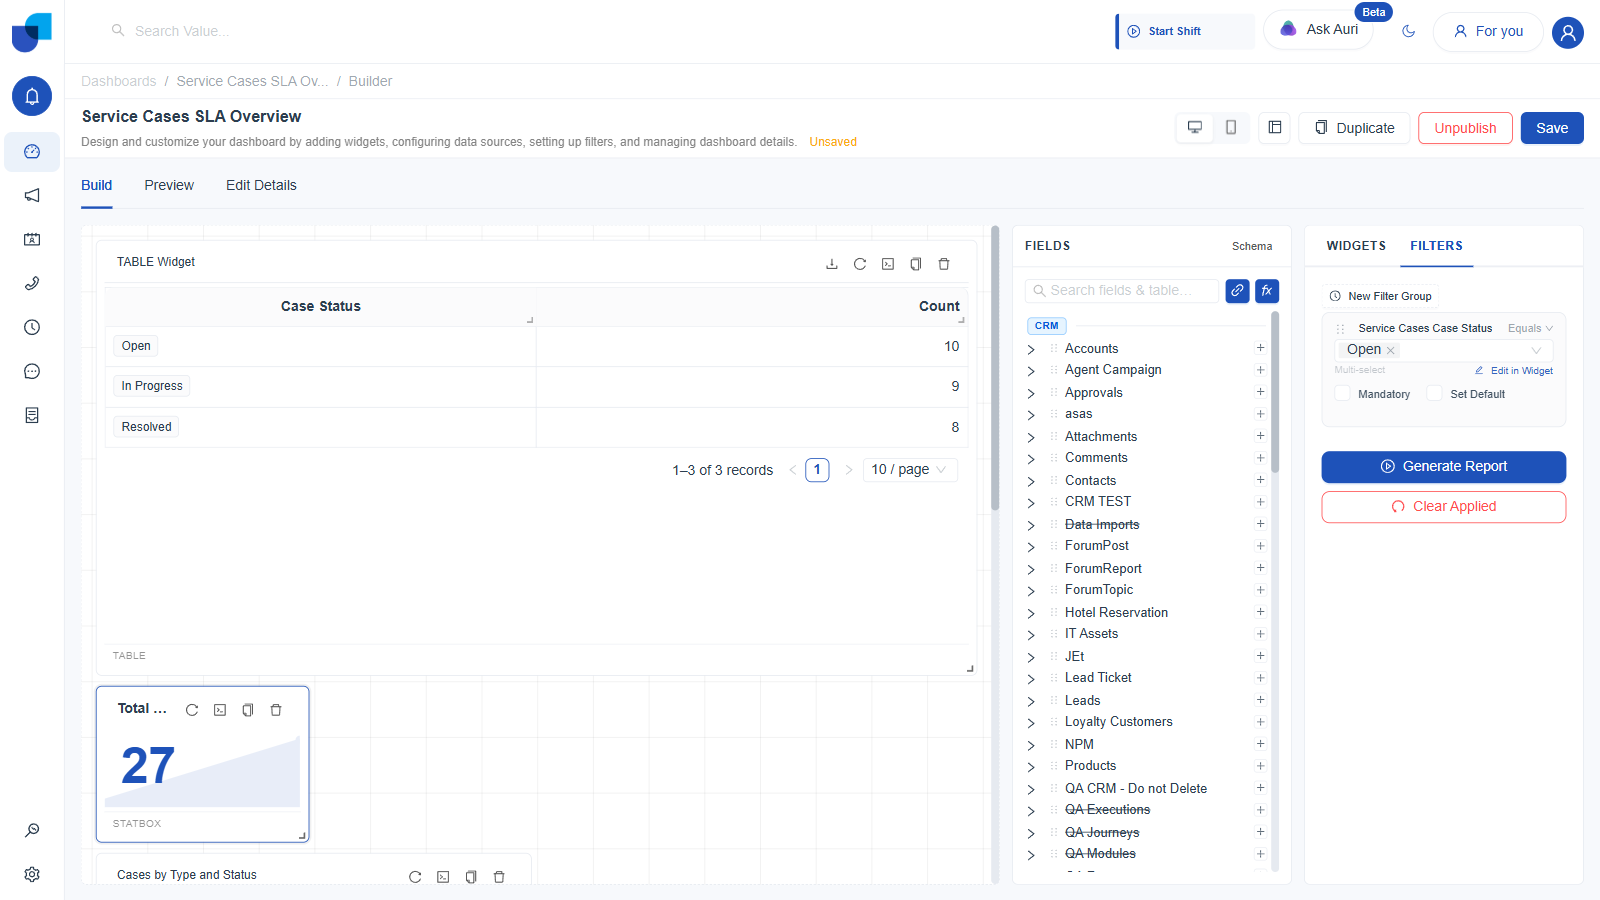
Figure 8. Global filter set to Open, Set Default ticked: the Stat widget is back to 10, now driven by the global control rather than its own local value.
Save and Publish the Dashboard
- Click Save in the Builder header.
- Click Publish. It flips to Unpublish, and the Edit Details tab's Visibility Controls switches to Published.
- Click Save again to persist that change.
Publishing and saving are two separate actions. Clicking Publish alone flips the in memory state, but the dashboard reverts to its prior visibility unless you also click Save afterward. This same sequence, Save, then Publish, then Save again, applies every time you change an item's visibility.
Leaving the Builder to the consumer view confirms the default value carried through: a Service Cases Case Status: Open chip appears immediately, with no action needed from the viewer, and the Stat tile already reads 10.
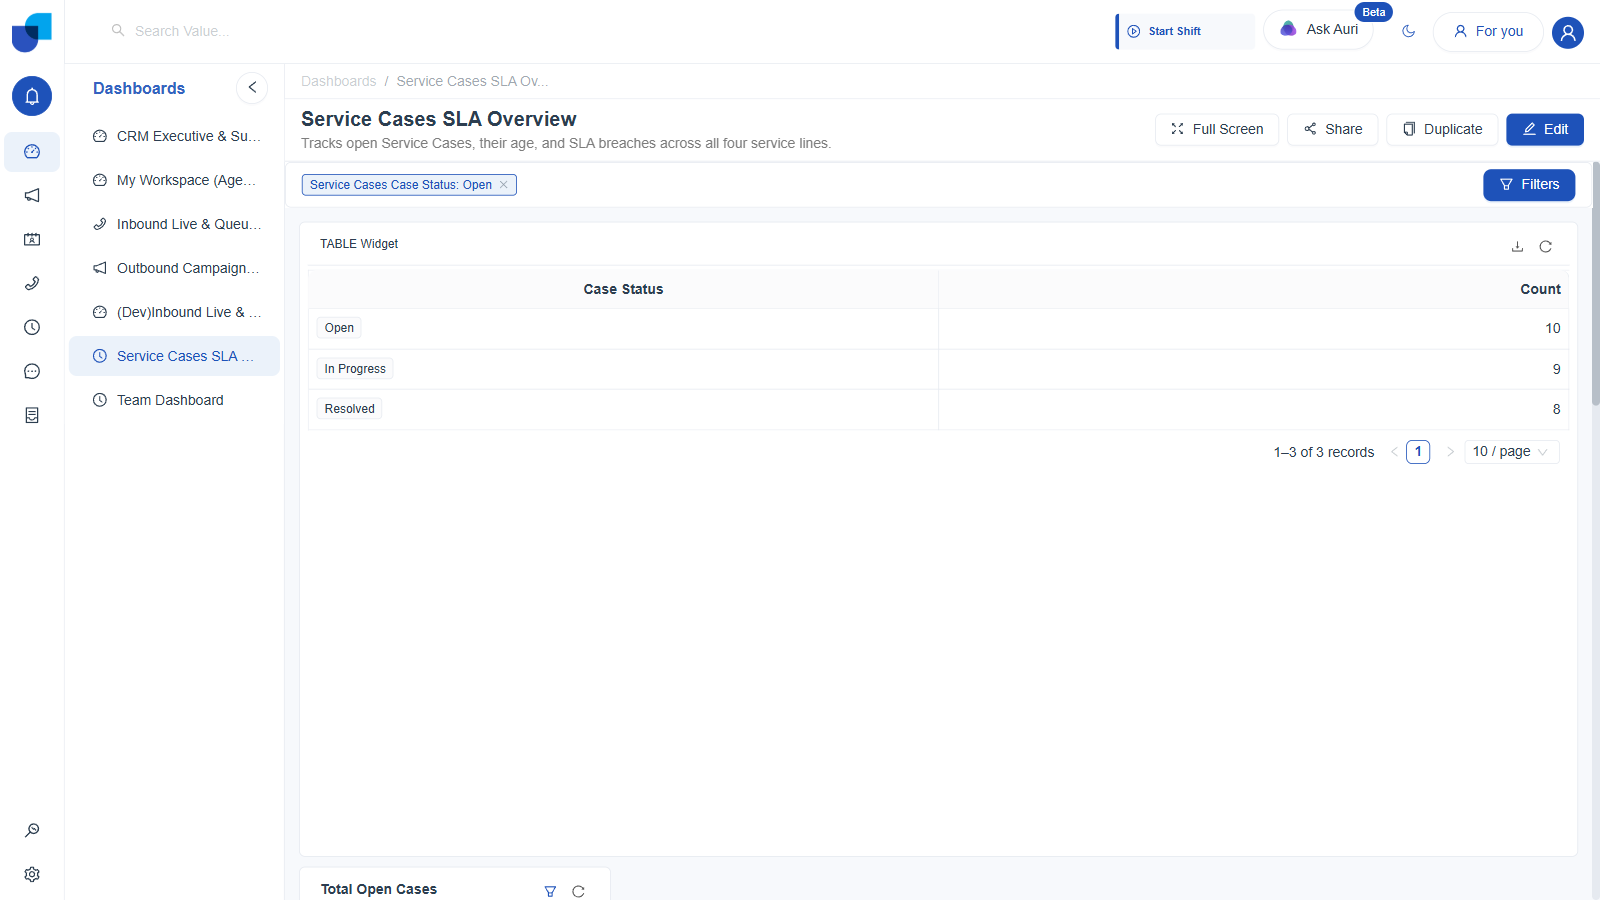
Figure 9. The published dashboard's consumer view: the default global filter chip is already applied on load.
- Click Filters in the top right corner of the consumer view to open the same control a viewer would use to change it.
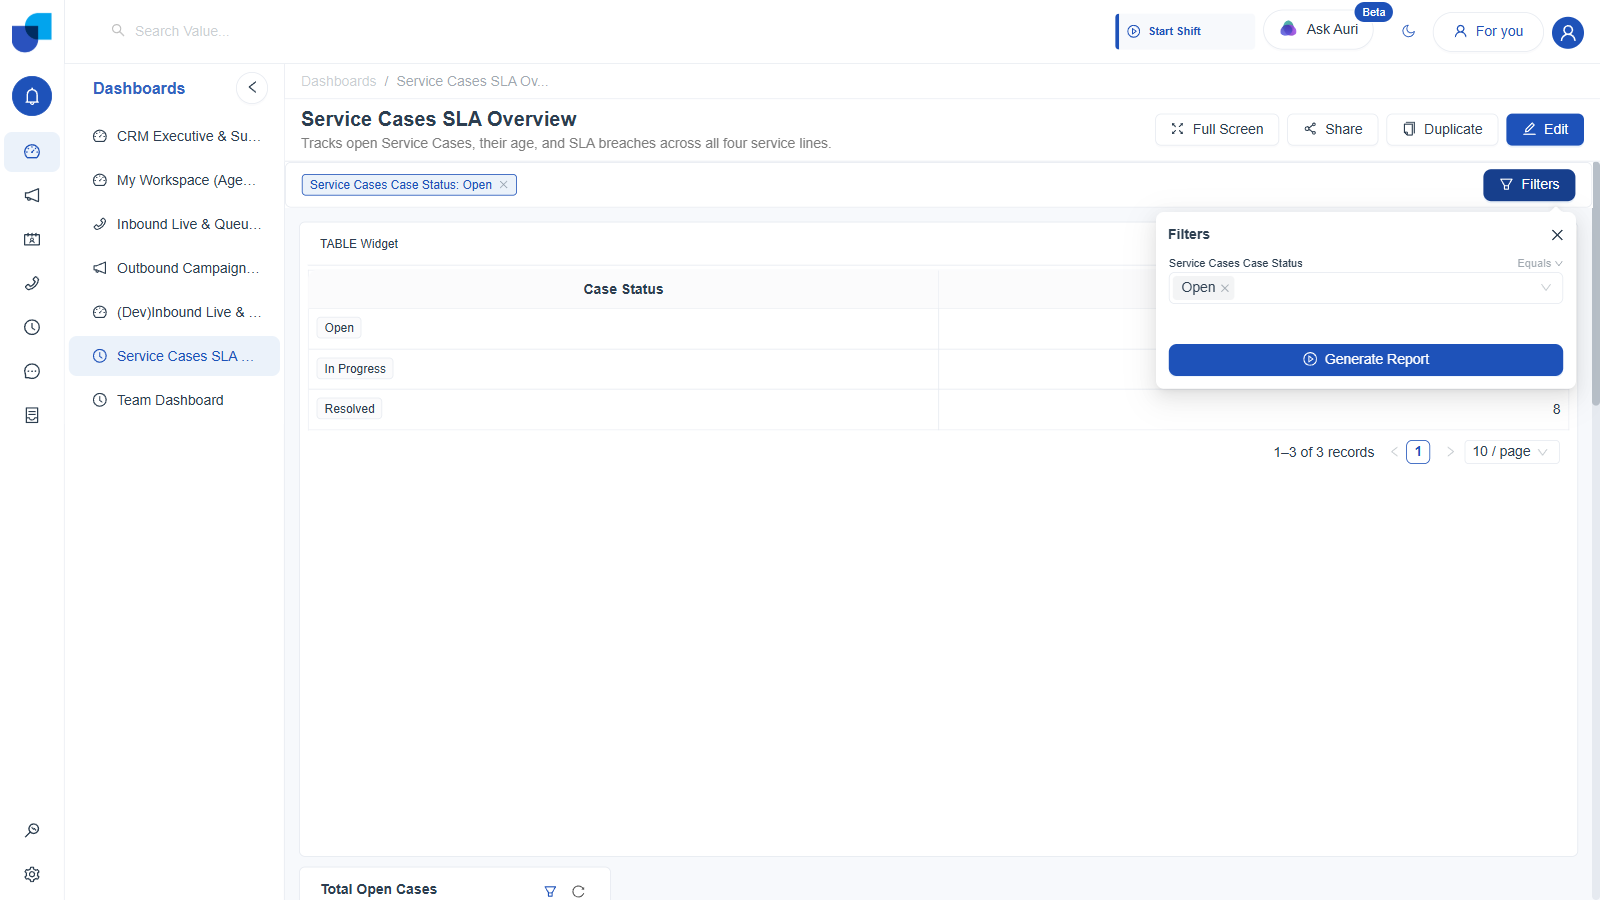
Figure 10. The Filters flyout, as a viewer sees it: Service Cases Case Status, Equals, Open, changeable on the spot.
Part 2: Create the Report
- Open Reports, then click Create. This opens as a right hand drawer, not a modal.
- Title:
Service Cases SLA Breach Report - Description:
Lists Service Cases that breached their SLA window, grouped by service line and assigned agent. - Click Save. This lands on
/reports/{id}/builder.
Widget 1: Table, Case Type, Case Status, and Count
- Click Table.
- Expand Service Cases in FIELDS.
- Drag Case Type onto Columns.
- Drag Case Status onto Columns, after Case Type.
- Drag Count onto Columns, after Case Status, so each service line and status combination shows how many cases it holds.
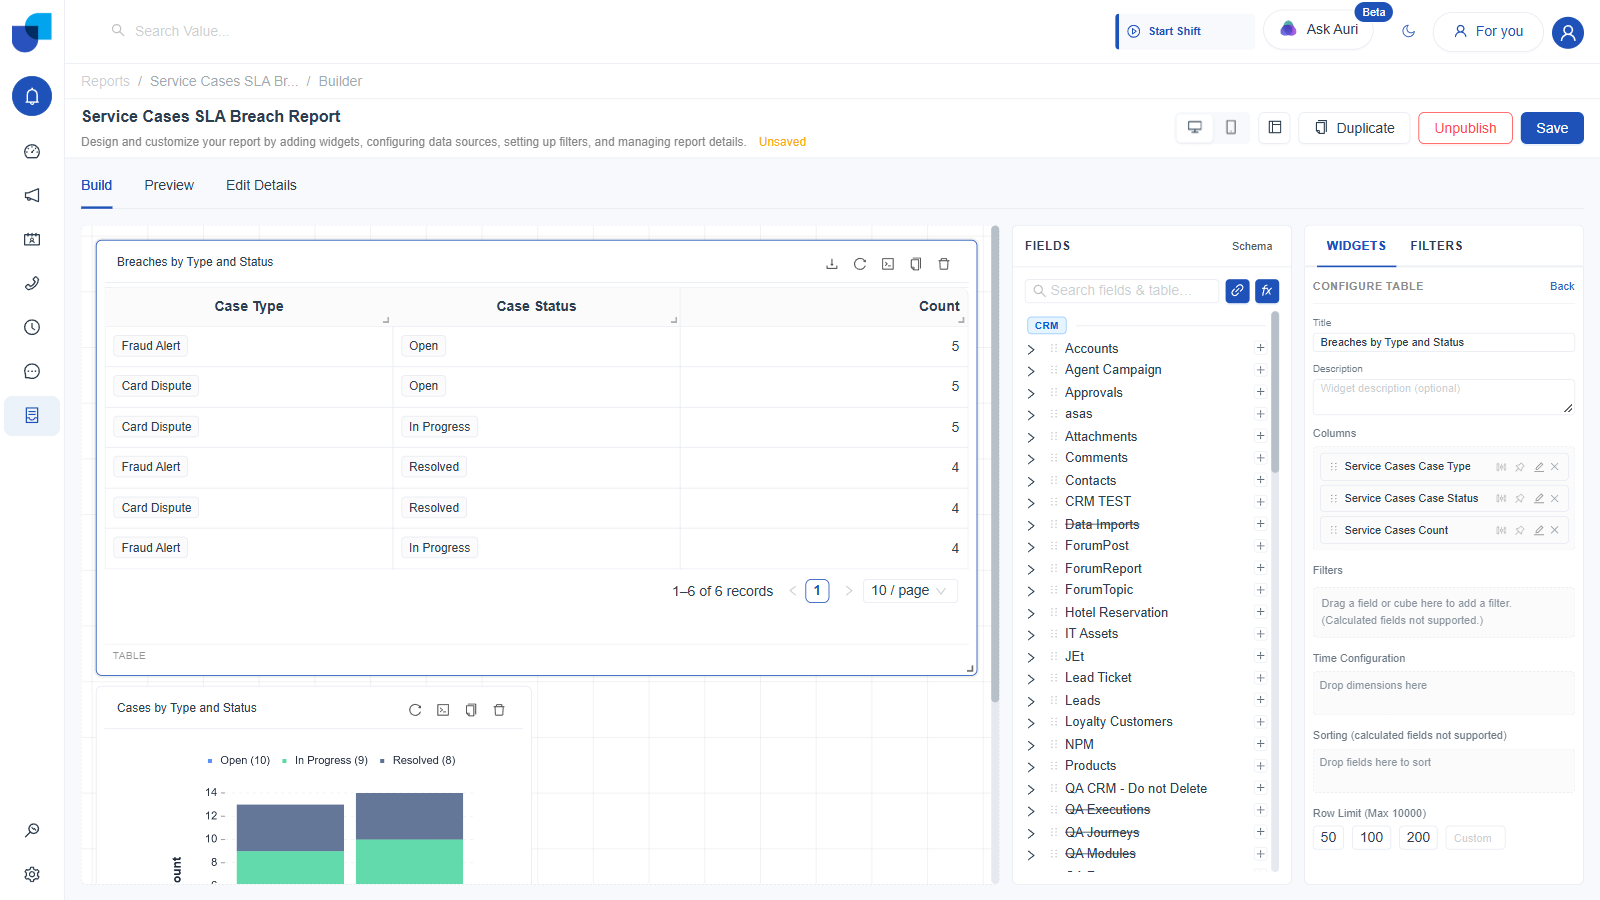
Figure 11. The report's Table widget: six rows, real counts, twenty seven cases summarized by service line and status.
Widget 2: Column, Cases by Type and Status
- Click Column.
- Drag Case Type onto Categories, Count onto Values, and Case Status onto Split By / Stack, the same shape used on the dashboard.
Adding a Global Filter to the Report
- Select the Table widget. Drag Case Type onto its own Filters zone.
- Tick Show in Global Filter beneath it.
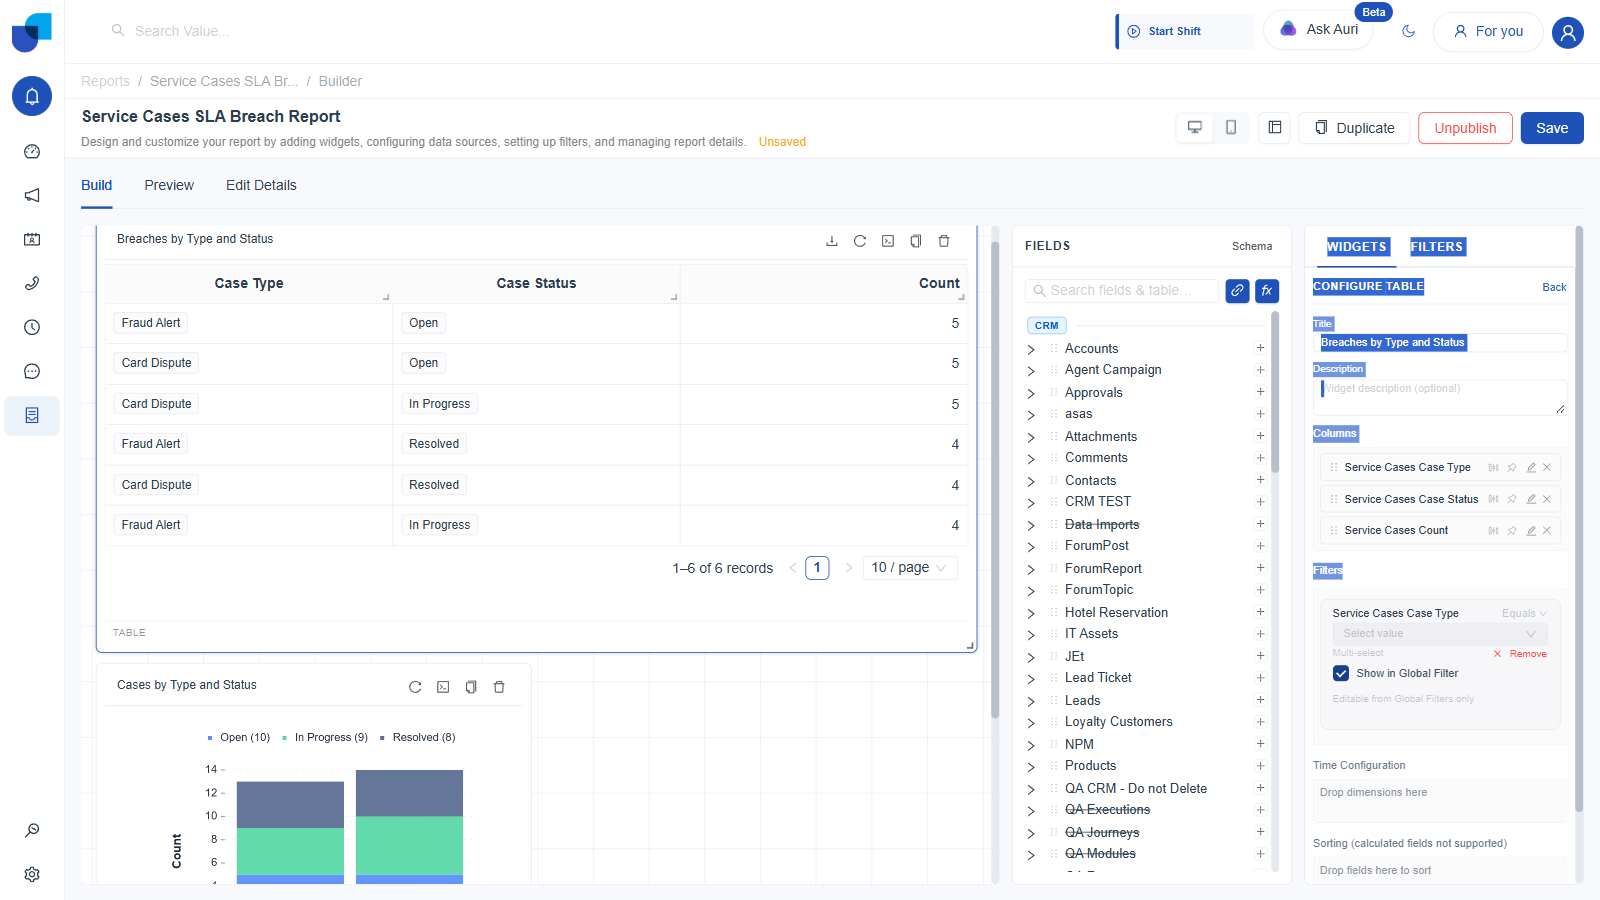
Figure 12. Show in Global Filter, ticked on the Table widget's Case Type filter.
- Click the FILTERS tab. Click the value picker and choose Card Dispute.
- Tick Set Default.
- Click Generate Report to confirm it against live data.
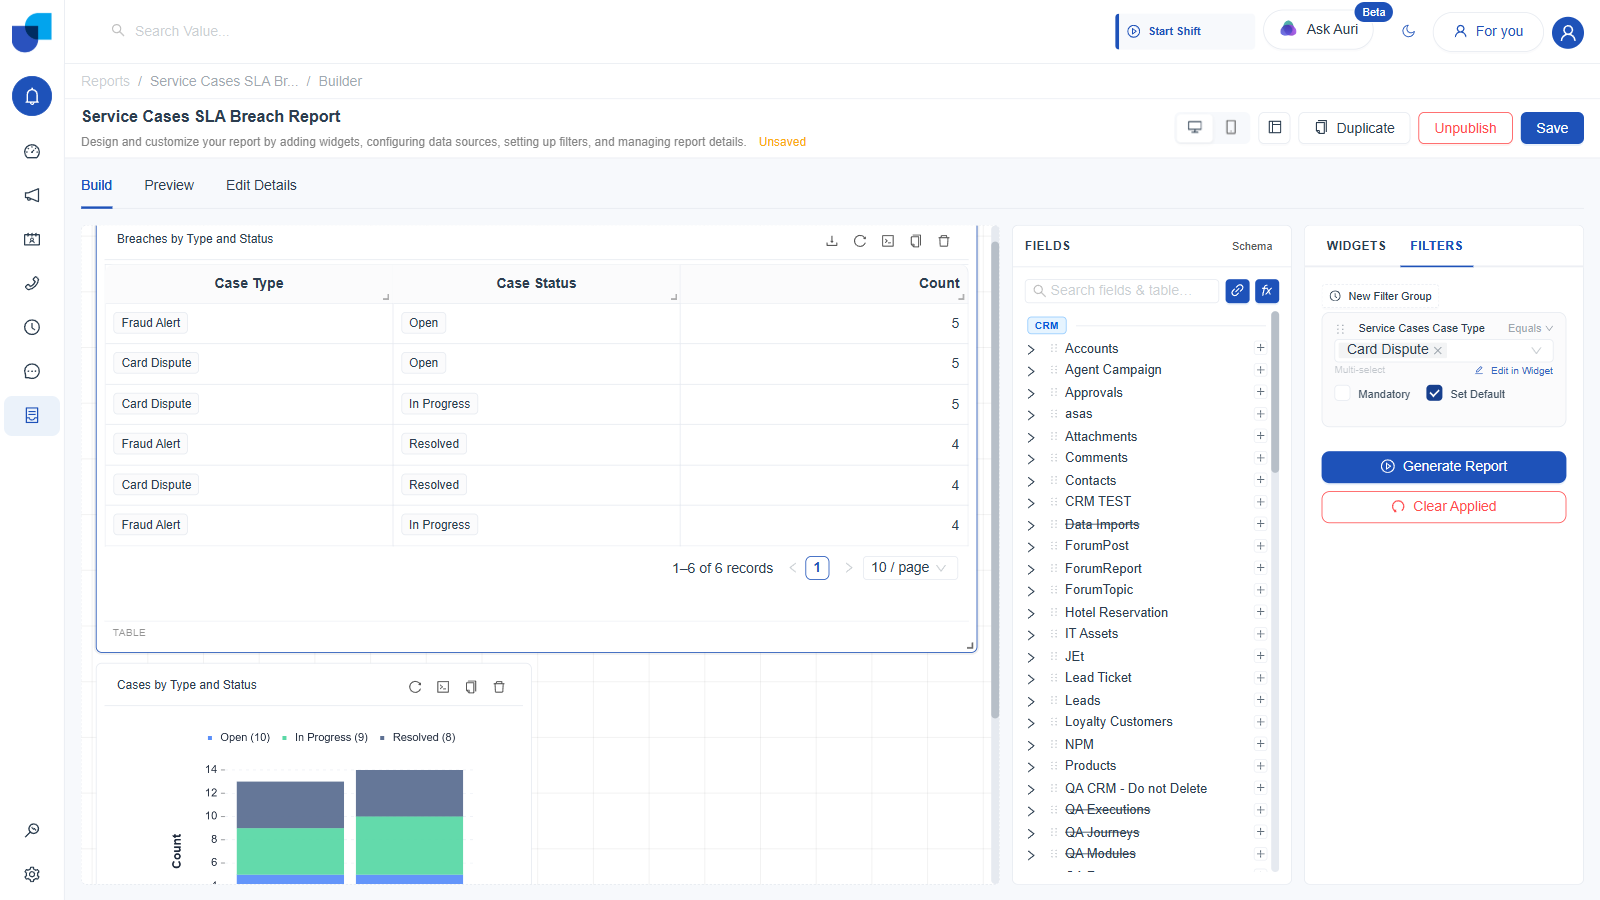
Figure 13. Global filter set to Card Dispute, Set Default ticked.
A filter promoted from one widget only drives that same widget, plus any other widget where the identical field has also been dragged into that widget's own Filters zone and separately ticked Show in Global Filter. It does not automatically reach every widget on the page just because one of them is now global; each widget opts in individually, field by field.
Save and Publish the Report
- Click Save, then Publish, then Save again. The identical three click sequence used for the dashboard.
The report's consumer view carries the same default behavior as the dashboard: the Service Cases Case Type: Card Dispute chip is already applied on load, narrowing the Table widget from six rows to three.
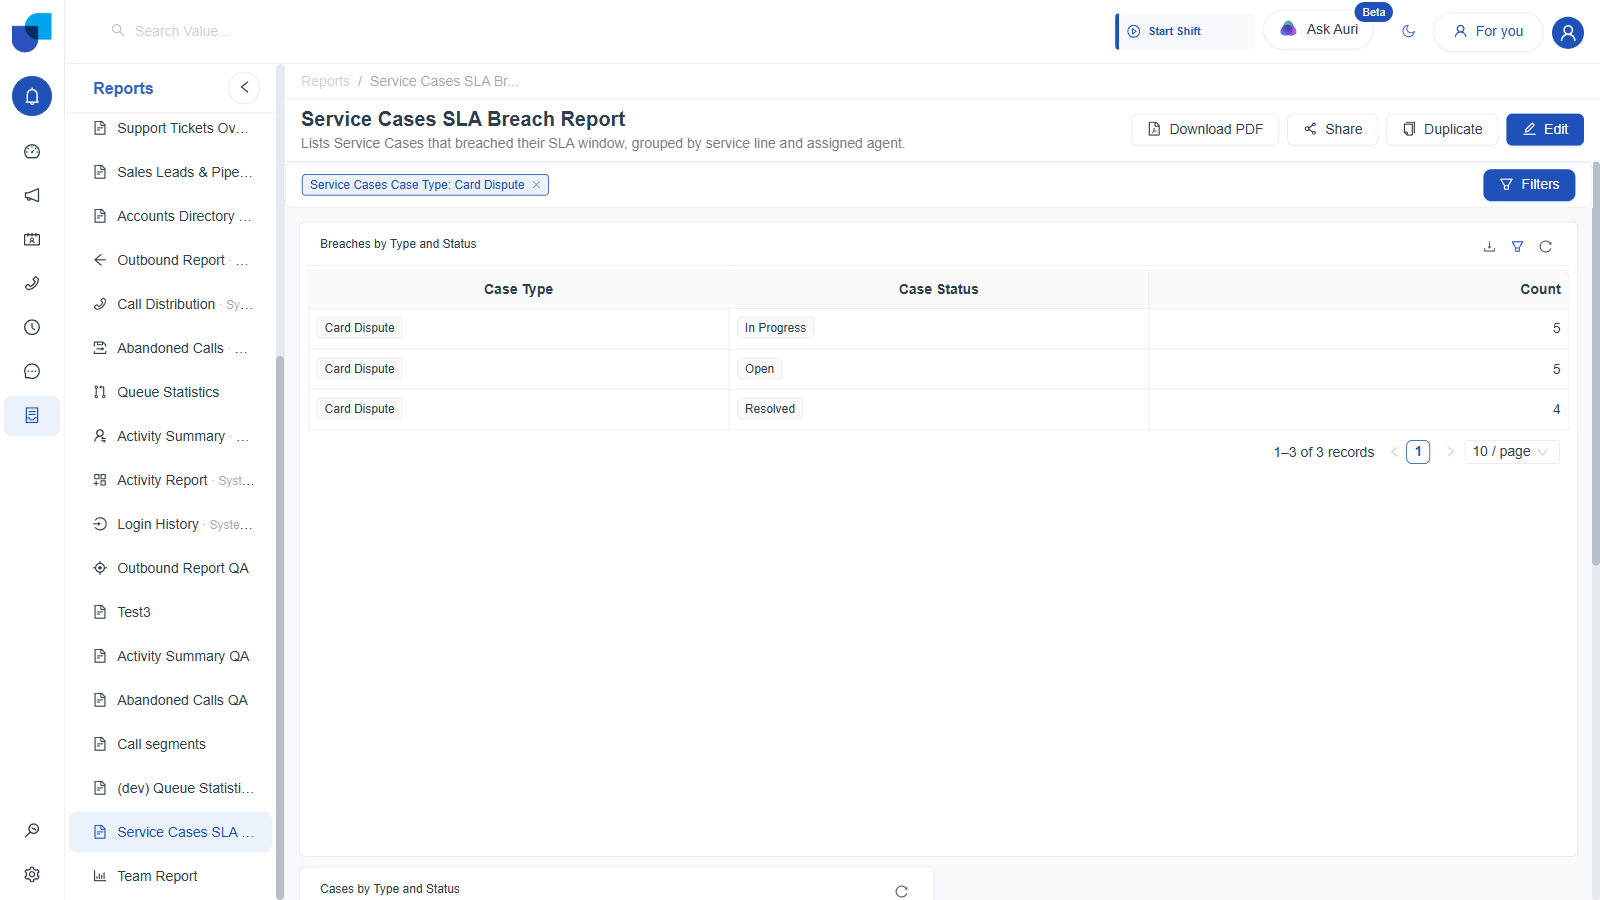
Figure 14. The published report's consumer view: the default global filter chip narrows the table to Card Dispute's three rows.
Confirming the Export Path
- Click Download PDF, leave the defaults in place, A4 Standard, Portrait, 100 percent scale, Current row count, and review the live preview.
- The PDF's own header metadata records
Filters Applied: Service Cases Case Type: Card Dispute, and the exported table carries only the three filtered rows, exactly matching the consumer view. - Click Download to save the file.
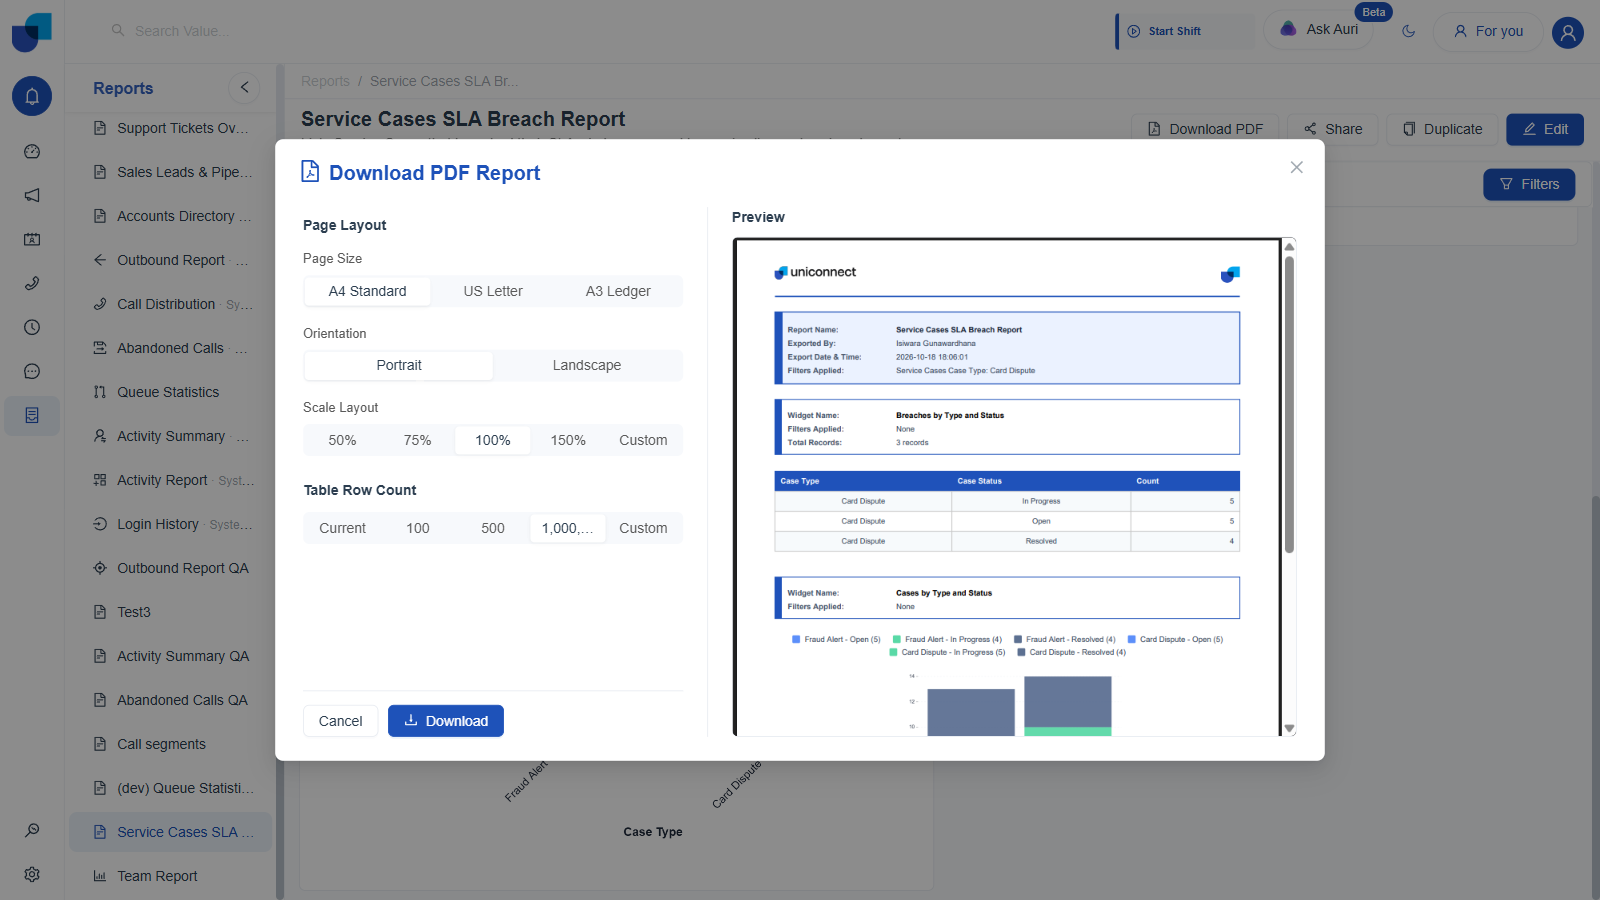
Figure 15. Download PDF Report: the live preview's header records the applied global filter, and the exported table matches the filtered consumer view.
Recap
| Step | Dashboard | Report |
|---|---|---|
| Create entry point | Centered modal | Right hand drawer |
| Widgets built | Table (Case Status, Count), Stat (Total Open Cases), Column (Case Type by Status), Pie (Case Reason) | Table (Case Type, Case Status, Count), Column (Case Type by Status) |
| Global filter | Case Status, default value Open | Case Type, default value Card Dispute |
| Publish sequence | Save, Publish, Save | Save, Publish, Save |
| Primary consumer action | Full Screen, for viewing live | Download PDF, for a file to share |
Every widget here is built the same way regardless of how many Service Cases exist underneath it. The configuration steps do not change whether the module holds one row or several dozen.