Execution History
Path: Monitoring → Automations → Execution History
Execution History is a single, platform wide table of every workflow run in the system, newest first, regardless of which workflow fired it. It is the first place to check when a specific run needs to be traced step by step, down to the exact data each node in it received.
Opening Execution History
- Go to Monitoring → Automations. Opens the Automation Execution Monitor, on its Execution History tab by default.
- If a different tab is open, click the Execution History tab. Sits beside Registry Health Check, just under the page title.
Reading the Table
- Use Search by workflow name to narrow the list. Sits directly above the table and filters by the Workflow column.
- Read each row. ID, Workflow, Status, Started At, Completed At, and Error.
| Column | Shows |
|---|---|
ID | The execution's own unique ID, separate from the workflow's own ID. |
Workflow | The name of the workflow that ran. |
Status | COMPLETED or FAILED. |
Started At | The exact timestamp the run began. |
Completed At | The exact timestamp the run finished, successfully or not. |
Error | The failure message, shown only when Status is FAILED. A dash otherwise. |
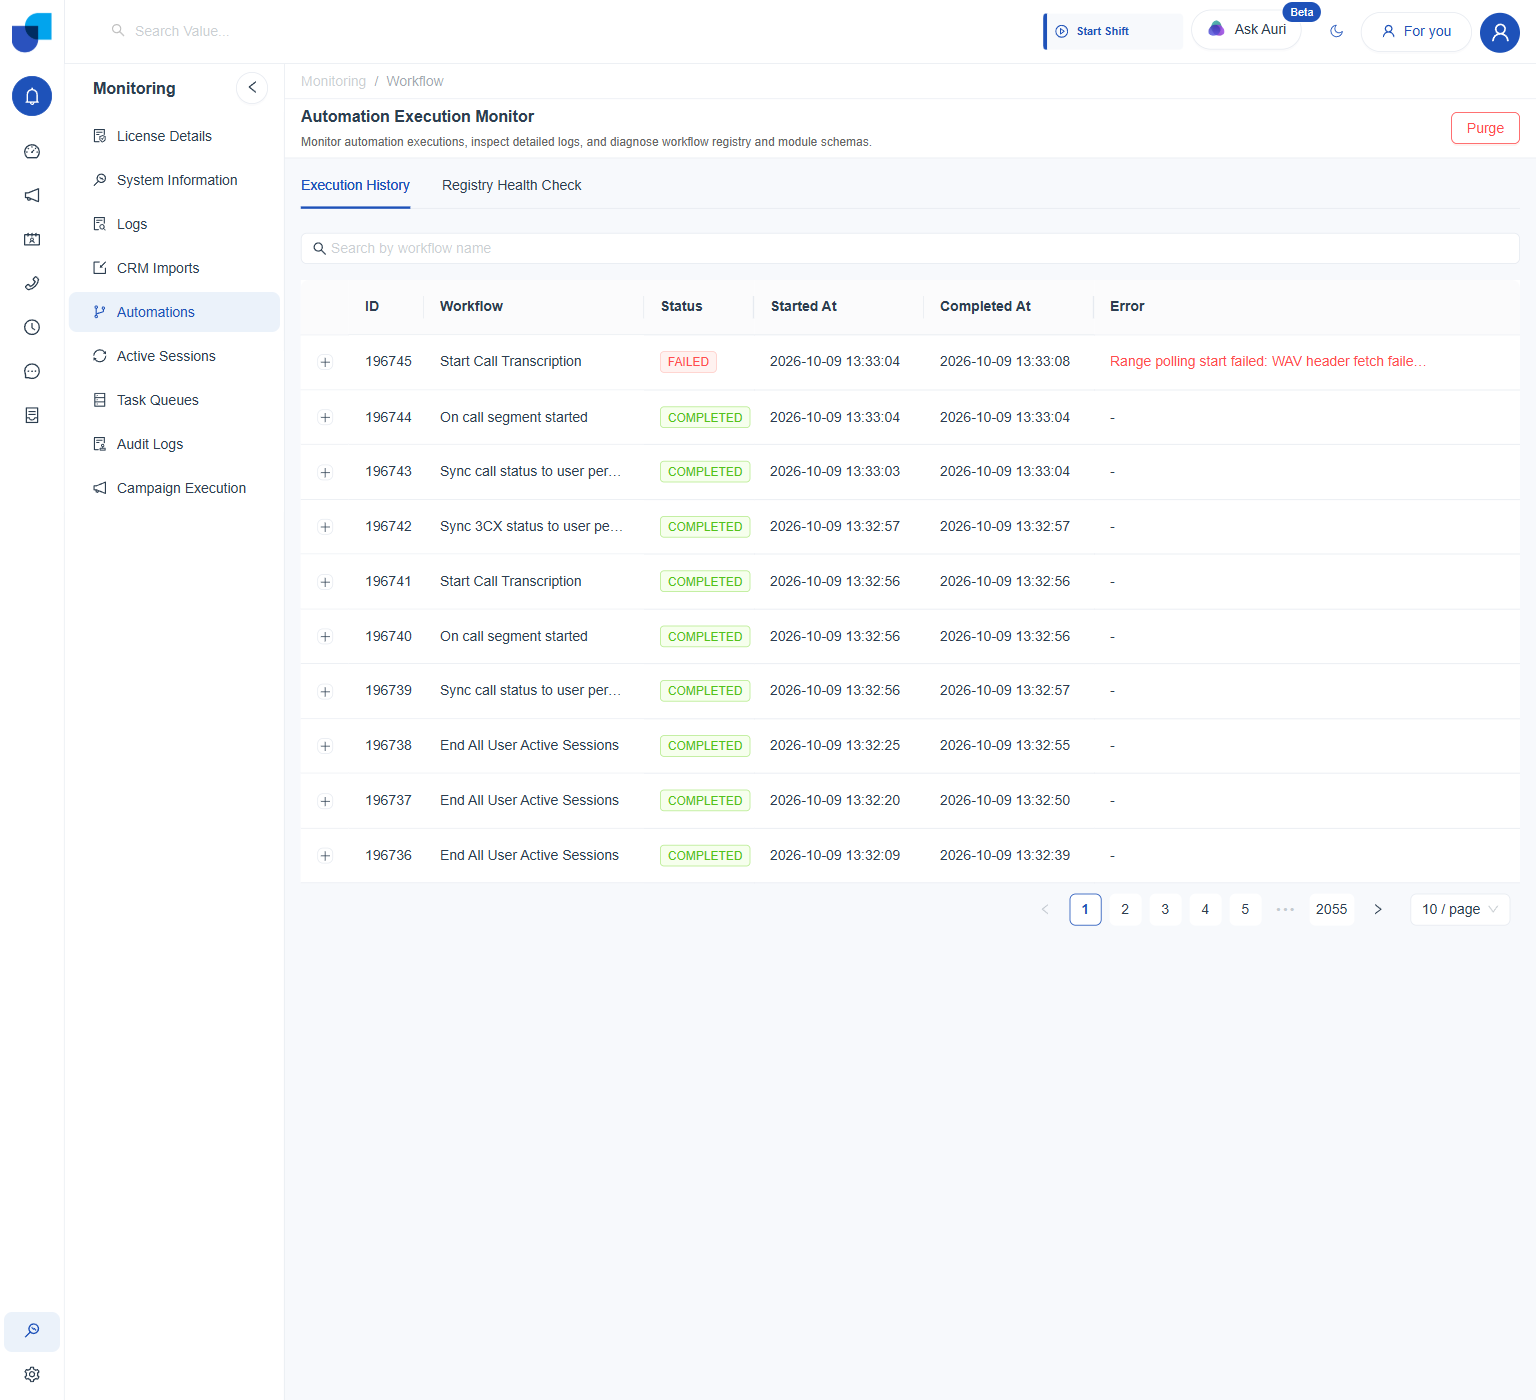
Figure 1. Execution History: a live feed covering every workflow, confirmed running into thousands of pages at 10 rows per page on this tenant.
Inspecting a Single Execution
- Click the expand icon at the start of any row. Opens Execution #[ID] Step Logs directly beneath that row, without leaving the page.
- Read the Step Logs table. One row per node the workflow actually ran, in the order it ran them.
| Column | Shows |
|---|---|
Node Type | trigger, condition, action, and so on, matching the Toolbox node types. |
Node Label | That node's own Label, as set in the Designer. |
Node Description | A short description of what the node does. For a Condition, this is the rule itself. |
Message | A dash when the node succeeded. The specific failure reason when it did not. |
Timestamp | When that individual node ran. |
Status | COMPLETED, SUCCESS, TRUE or FALSE for a Condition, or ERROR. |
Action | A Data button, opening that node's full payload. |
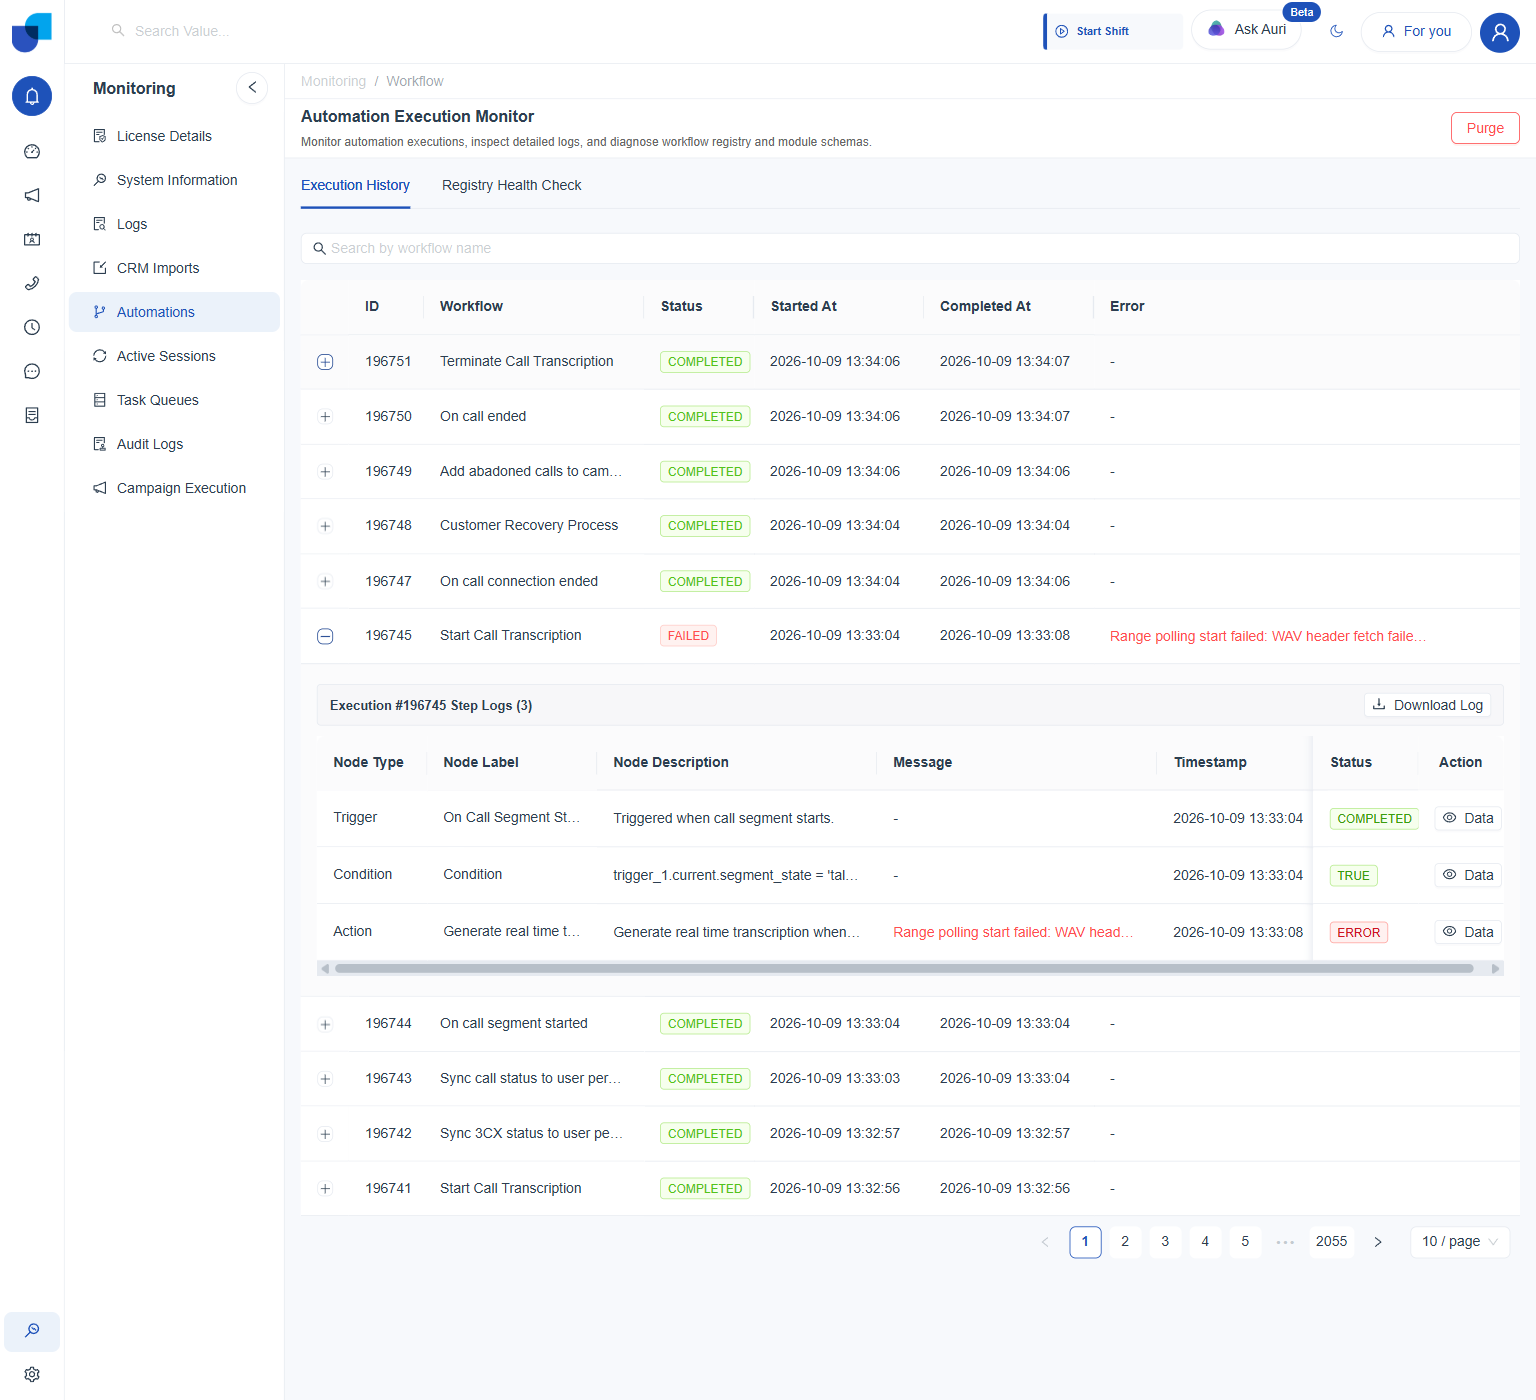
Figure 2. Step Logs for one failed execution: the Trigger and Condition both completed and the Condition evaluated TRUE, so the failure traces to the Action step specifically. A Download Log button sits above the step table, and the whole execution's Error message appears directly in the main table.
A step's Status can read SUCCESS as well as COMPLETED. Both mean the node finished without error. Which of the two appears depends on the node type, so don't treat SUCCESS as a different, unexplained outcome if it shows up on a step you expected to say COMPLETED.
Viewing a Step's Raw Data
- Click Data beside any step in the Step Logs table.
Opens a Workflow Log Details dialog, titled with that node's own ID, for example
#trigger_1. - Read the summary row: Timestamp, Status, Node Label, Node Type, Description.
- Toggle Formatted or Raw JSON above the Data table. Formatted is the default, readable view. Raw JSON shows the same content as plain, unformatted JSON text.
- Click Copy to copy the data to the clipboard.
- Close the dialog once finished.
| Field | What it holds |
|---|---|
data | The actual record or payload the node received, exactly as the system saw it. |
oldData | The record's previous state, when relevant, for example on an update. null otherwise. |
metadata | Context about the event itself: a source, a userId, and a timestamp. |
eventType | The specific event name that fired the node, for example CALL-SEGMENT-STARTED. |
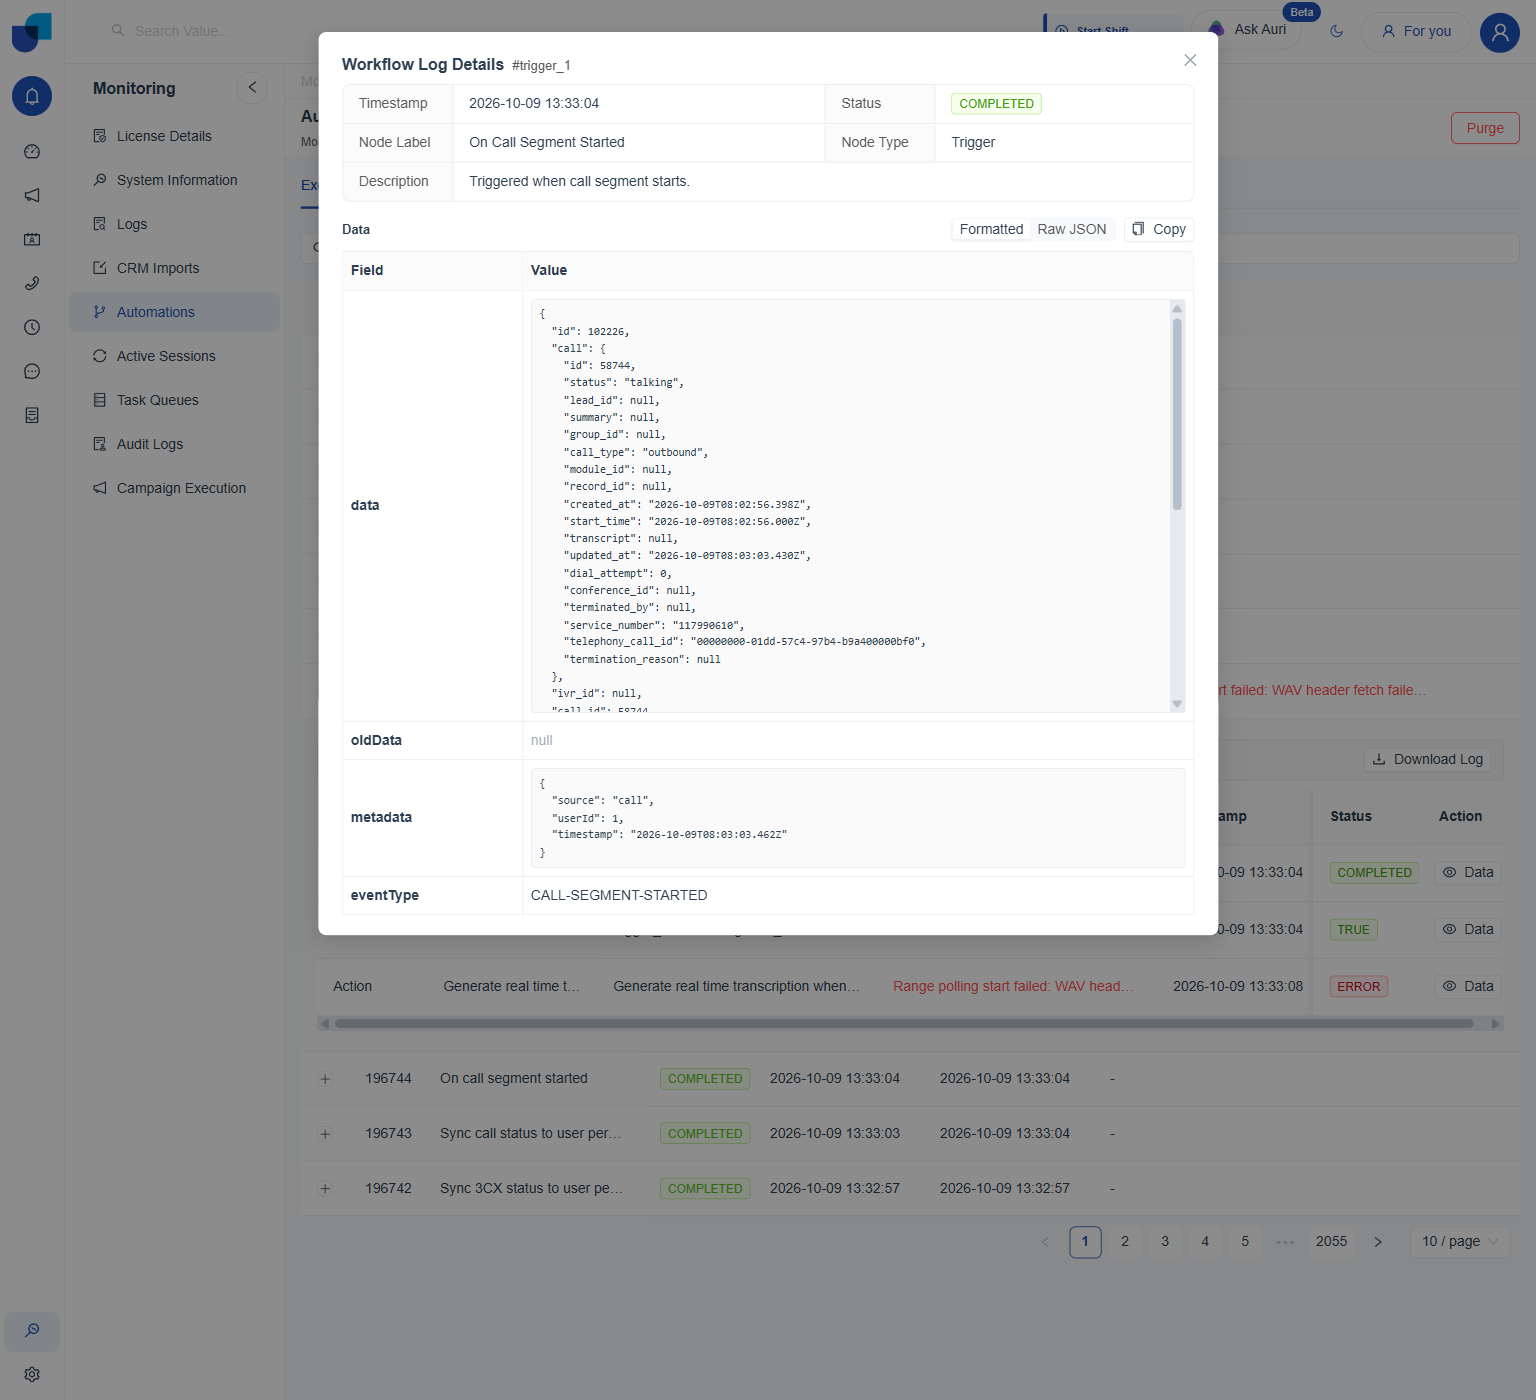
Figure 3. A Trigger step's Data view: the real call record it received, plus a metadata block identifying the event's source and timing.
Downloading a Full Execution Log
- Expand the execution row.
- Click Download Log, above the Step Logs table.
A Purge button sits in the top right of the whole Automation Execution Monitor page, confirmed to exist but not tested in this session to avoid deleting real execution history. Treat it as a destructive action, likely clearing some or all of Execution History, and confirm exactly what it clears before using it on a live environment.
Execution History is scoped to a single run of a single workflow. For checking whether the Trigger and Action catalog itself is healthy, including whether a saved workflow's nodes still reference triggers or actions that actually exist, use Registry Health Check instead, documented separately.