Automation Monitoring
Path: Monitoring → Automations
The Automation Execution Monitor is where every workflow run in the system can be inspected after the fact, and where the Trigger and Action catalog itself can be checked for integrity. It is separate from a single workflow's own History tab in the Designer, which only covers that one workflow's saved versions. This page covers every execution across every workflow, platform wide.
Opening Automation Monitoring
- Go to Monitoring → Automations. Opens the Automation Execution Monitor, titled Monitor automation executions, inspect detailed logs, and diagnose workflow registry and module schemas.
- Choose a tab: Execution History or Registry Health Check.
A Purge button sits top right, confirmed but untested here. Treat it as destructive and confirm its scope first.
Execution History
A single table listing every workflow execution across the system, newest first, regardless of which workflow triggered it.
| Column | Shows |
|---|---|
ID | The execution's own unique ID, separate from the workflow's ID. |
Workflow | The name of the workflow that ran. |
Status | COMPLETED or FAILED. |
Started At / Completed At | Exact timestamps for the run. |
Error | The failure message, when Status is FAILED. A dash otherwise. |
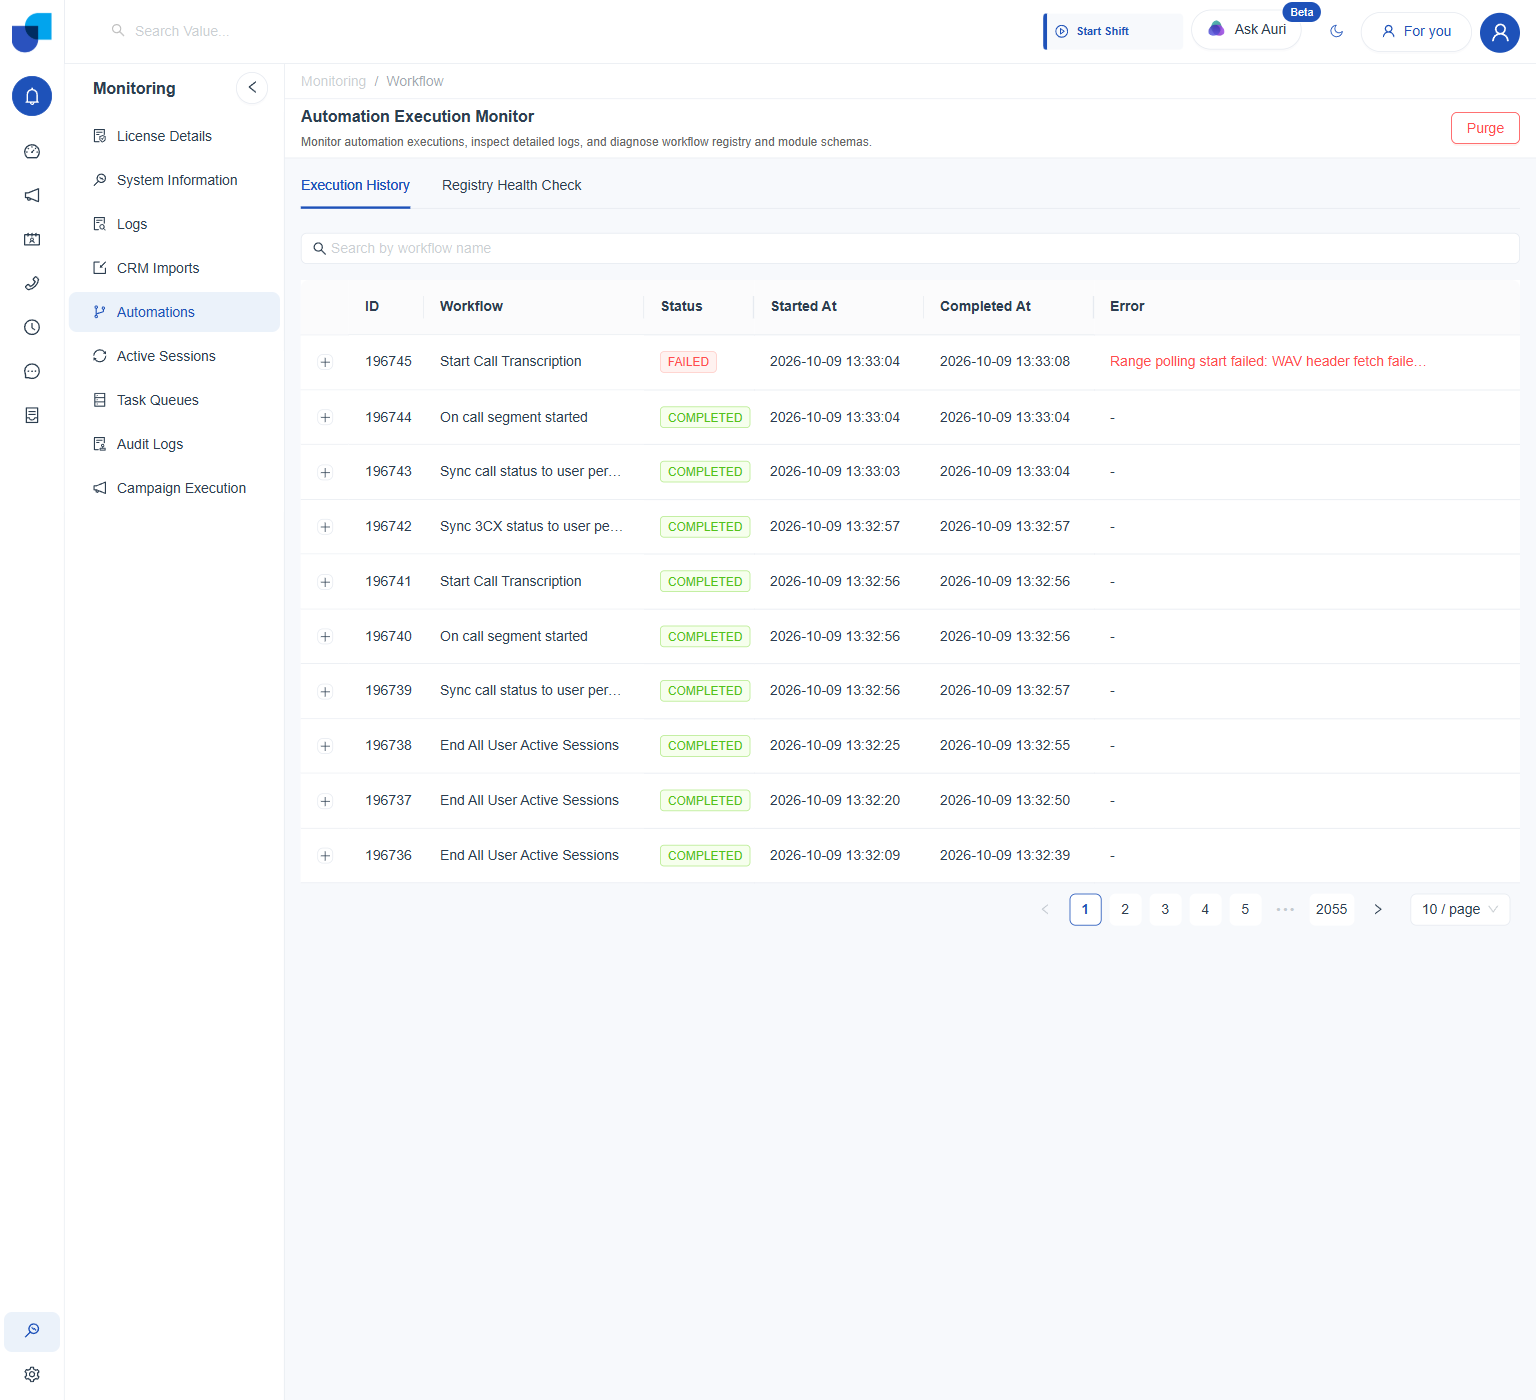
Figure 1. Execution History: a live, platform wide feed of workflow runs. A Search by workflow name box sits above the table.
Inspecting a Single Execution
- Click the expand icon on any row. Opens that execution's full Step Logs beneath it, one row per node the workflow actually ran, each with its own Status.
- Click Data beside any step. Opens a Workflow Log Details dialog for that specific node: Timestamp, Status, Node Label, Node Type, Description, and the actual data the node received, shown as Formatted or Raw JSON, with a Copy button.
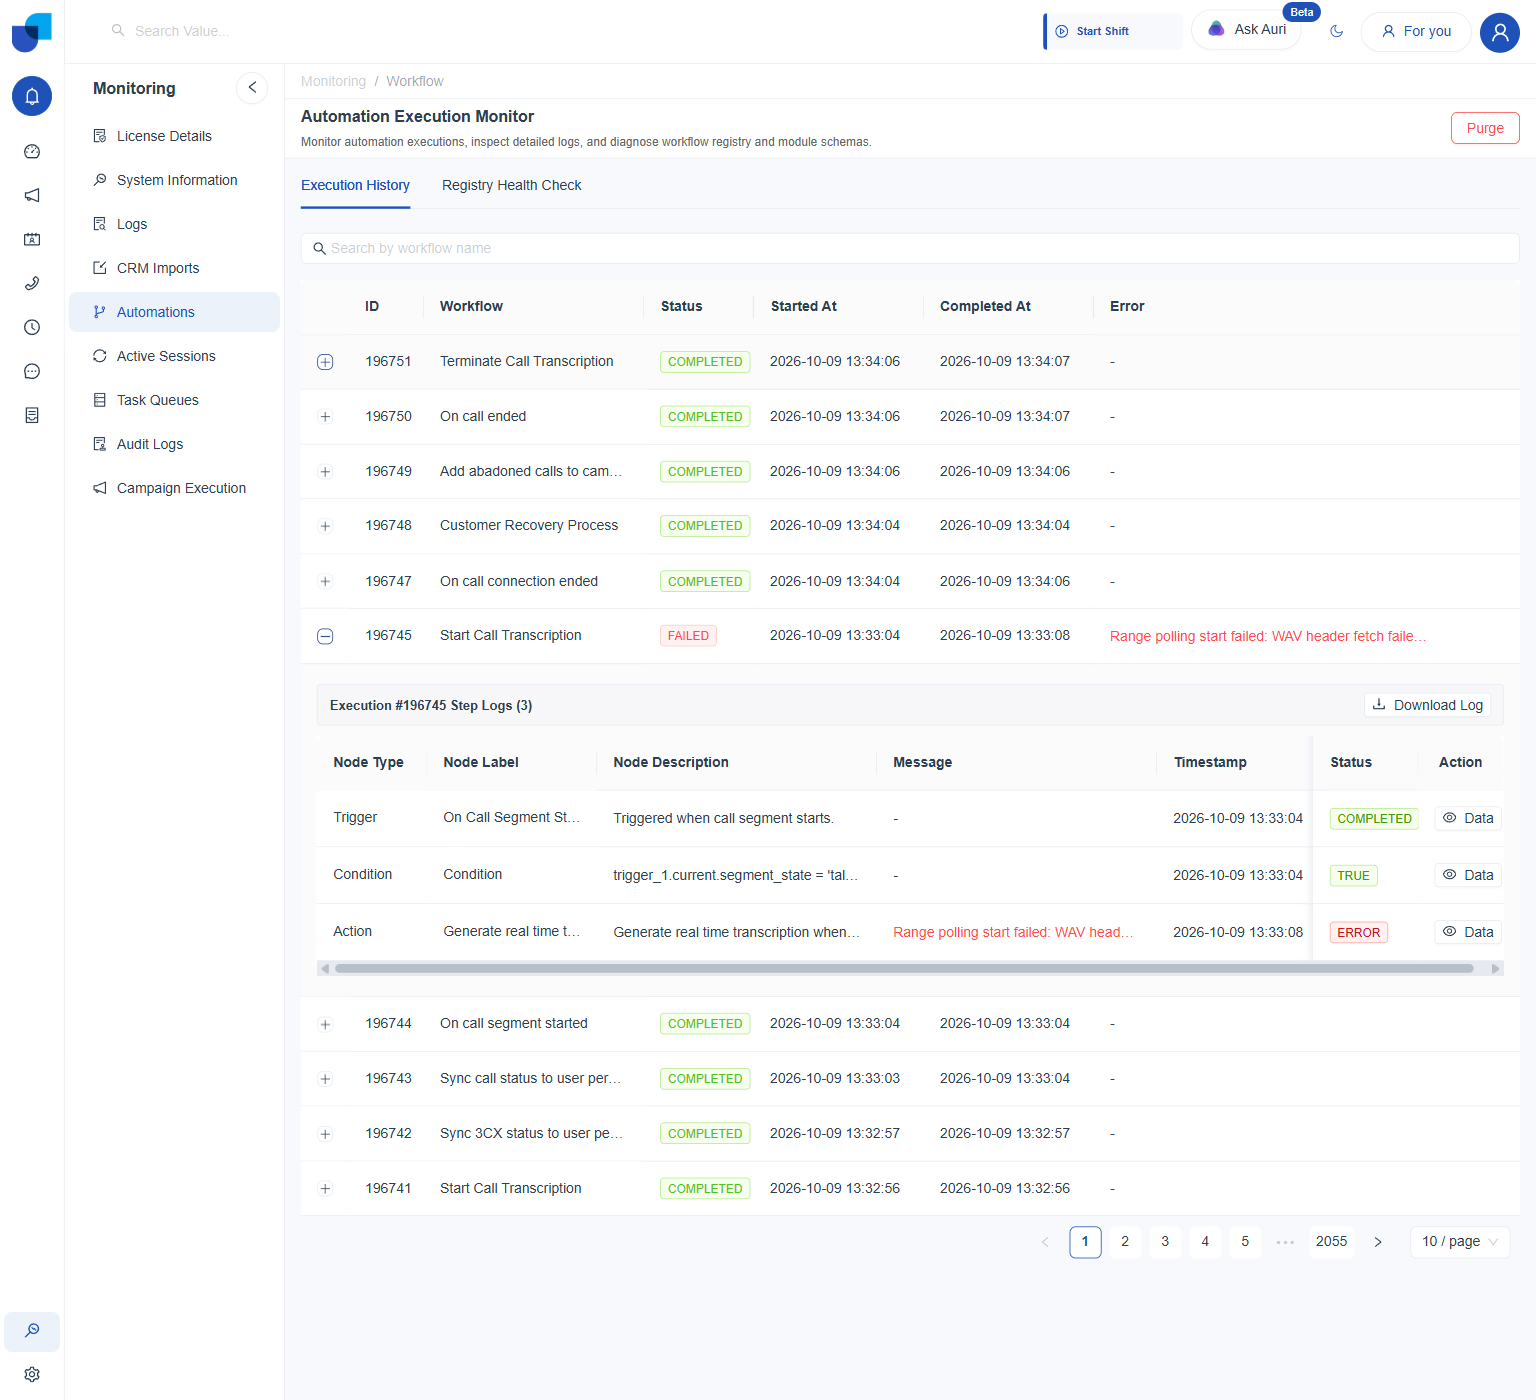
Figure 2. Step Logs for a single failed execution: the Trigger and Condition both completed, the Action step is where it actually failed. A Download Log button sits above the step table.
Viewing a Step's Raw Data
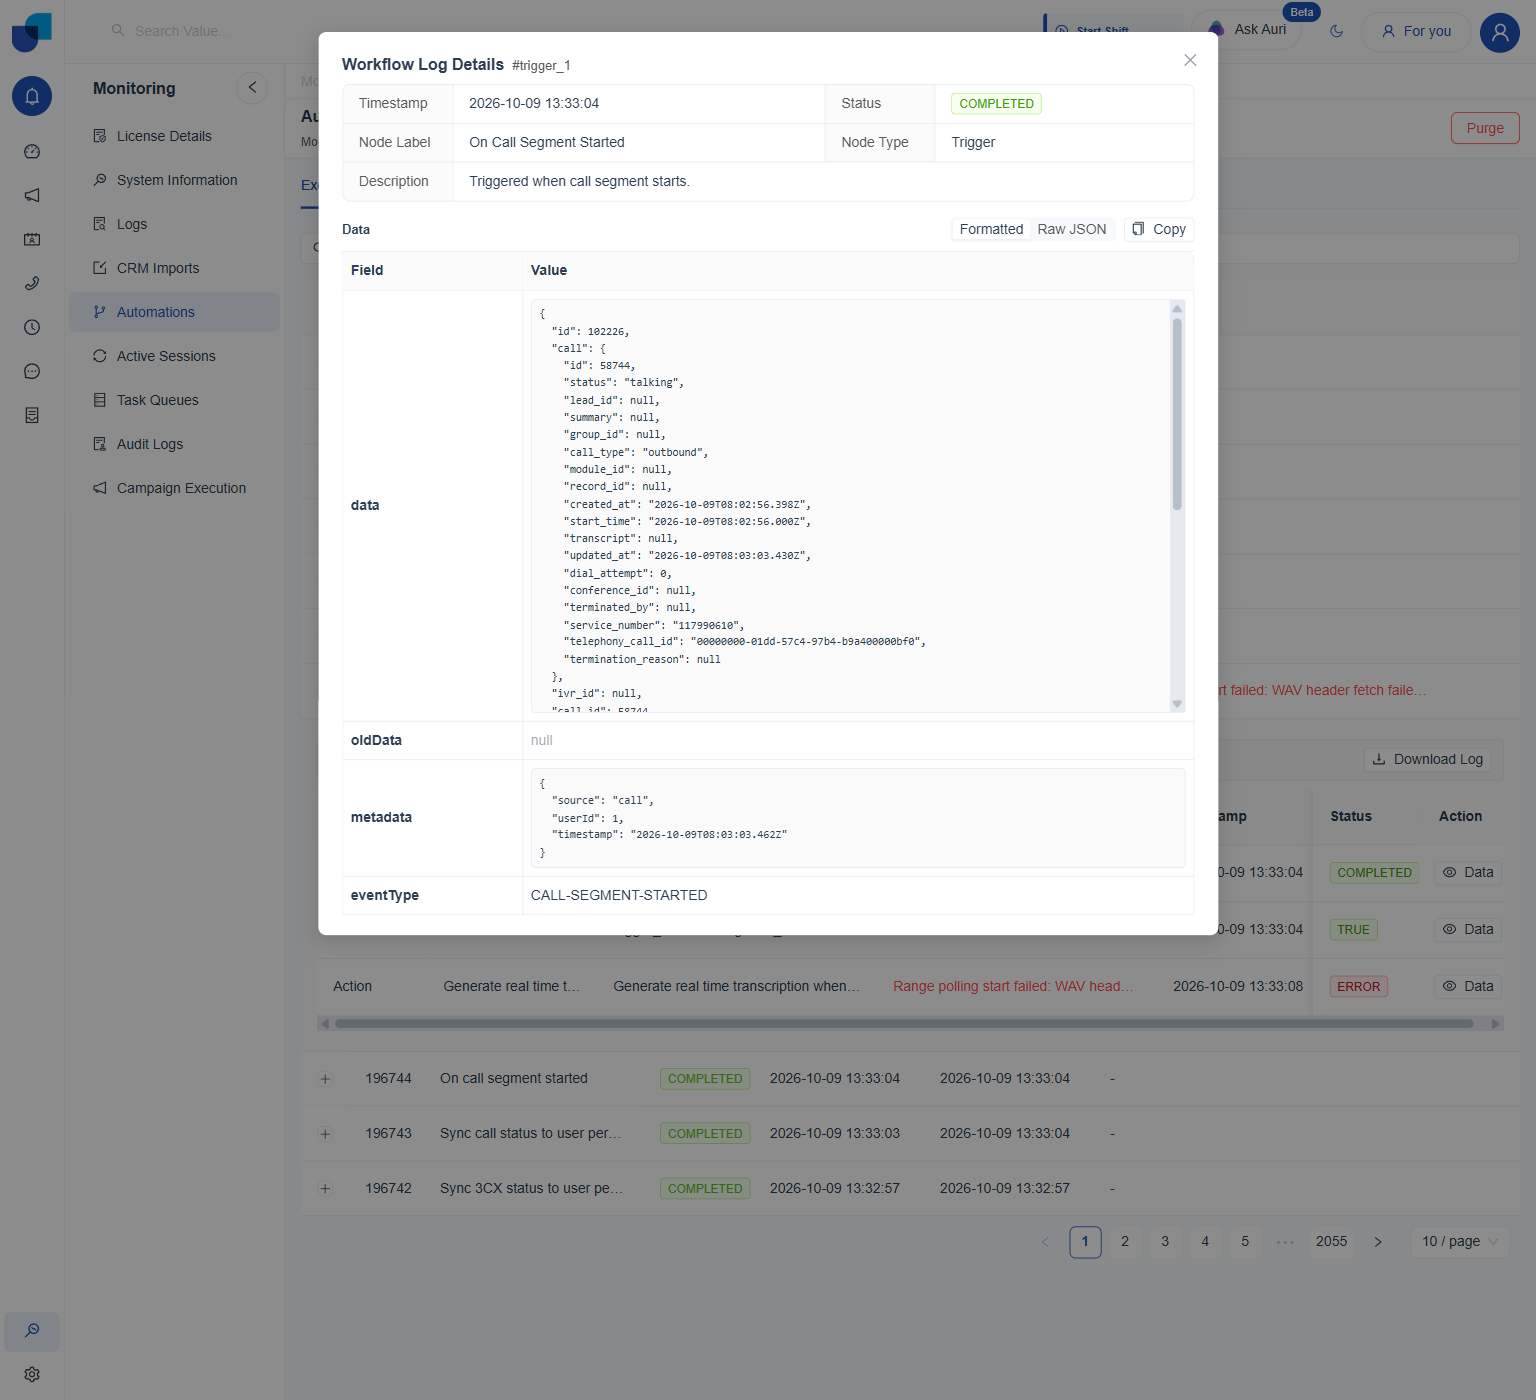
Figure 3. A step's Data view: the real payload the node received, including a metadata block with source, userId, and timestamp, and an eventType.
Start here when one specific workflow run misbehaves. Task Queues Monitoring covers broader infrastructure issues instead.
Registry Health Check
The second tab checks the integrity of the Trigger and Action catalog itself, separate from any single execution. It confirms every module the system discovered is reachable, and that every saved workflow's nodes still reference triggers and actions that actually exist.
- Click Run Health Check. Re-runs the check and updates the Checked at time shown in the summary banner.
- Read the summary banner and the four metric cards. Discovered Modules, Healthy Modules, Schema Warnings, and Endpoint Errors.
- Scan Saved Workflows Health.
Every saved workflow, by name and ID, marked
PASSorERROR. - Expand an ERROR row for the exact reason.
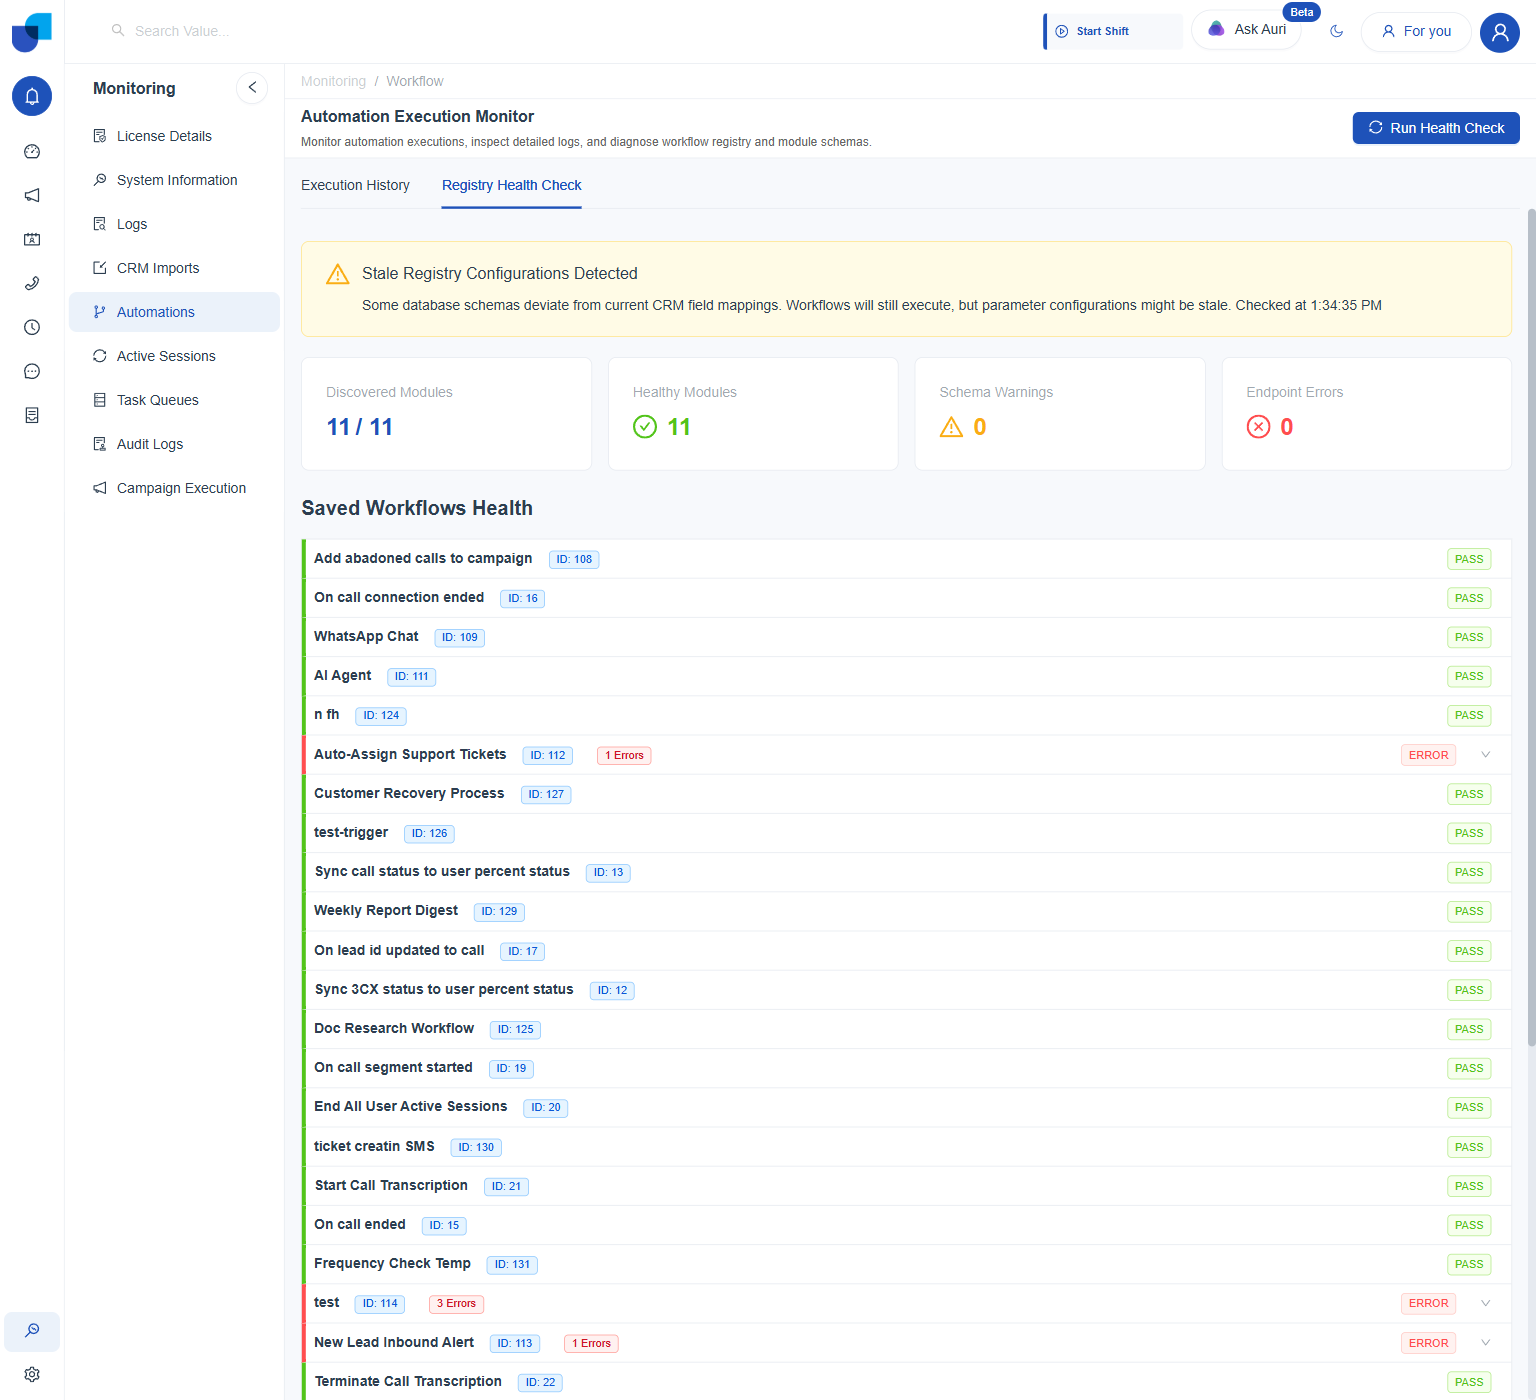
Figure 4. Registry Health Check: a platform wide integrity scan, not tied to any single workflow run.
A real example: workflow 113 showed ERROR, its Trigger ID unrecognized by the catalog. Registry Health Check confirms broken references like this directly.
Registered Module Configurations
Beneath Saved Workflows Health, a second list reports every module the Trigger and Action catalog actually discovered, with its own Actions and Triggers counts. This is the same catalog documented in the Trigger Categories and Action Categories pages, confirmed here from a different angle.
| Module | Actions | Triggers |
|---|---|---|
campaign | 11 | 5 |
ai | 5 | 0 |
statusManagement | 10 | 6 |
messaging | 9 | 1 |
users | 7 | 8 |
groups | 4 | 5 |
calls | 9 | 10 |
edge | 3 | 0 |
emailProvider | 2 | 1 |
config | 6 | 0 |
integrations | 1 | 0 |
These are internal module keys, not their Designer names. calls here means Telephony. CRM modules are counted separately, under their own categories.