Getting Started
Open Monitoring and make a first pass through its pages.
Open Monitoring
- Click Monitoring in the main menu. A side menu opens with nine items: License Details, System Information, Logs, CRM Imports, Automations, Active Sessions, Task Queues, Audit Logs and Campaign Execution.
- Choose License Details. It is the first item and a good page to open first.
- Use the side menu to move between pages. It stays on the left of every Monitoring page.
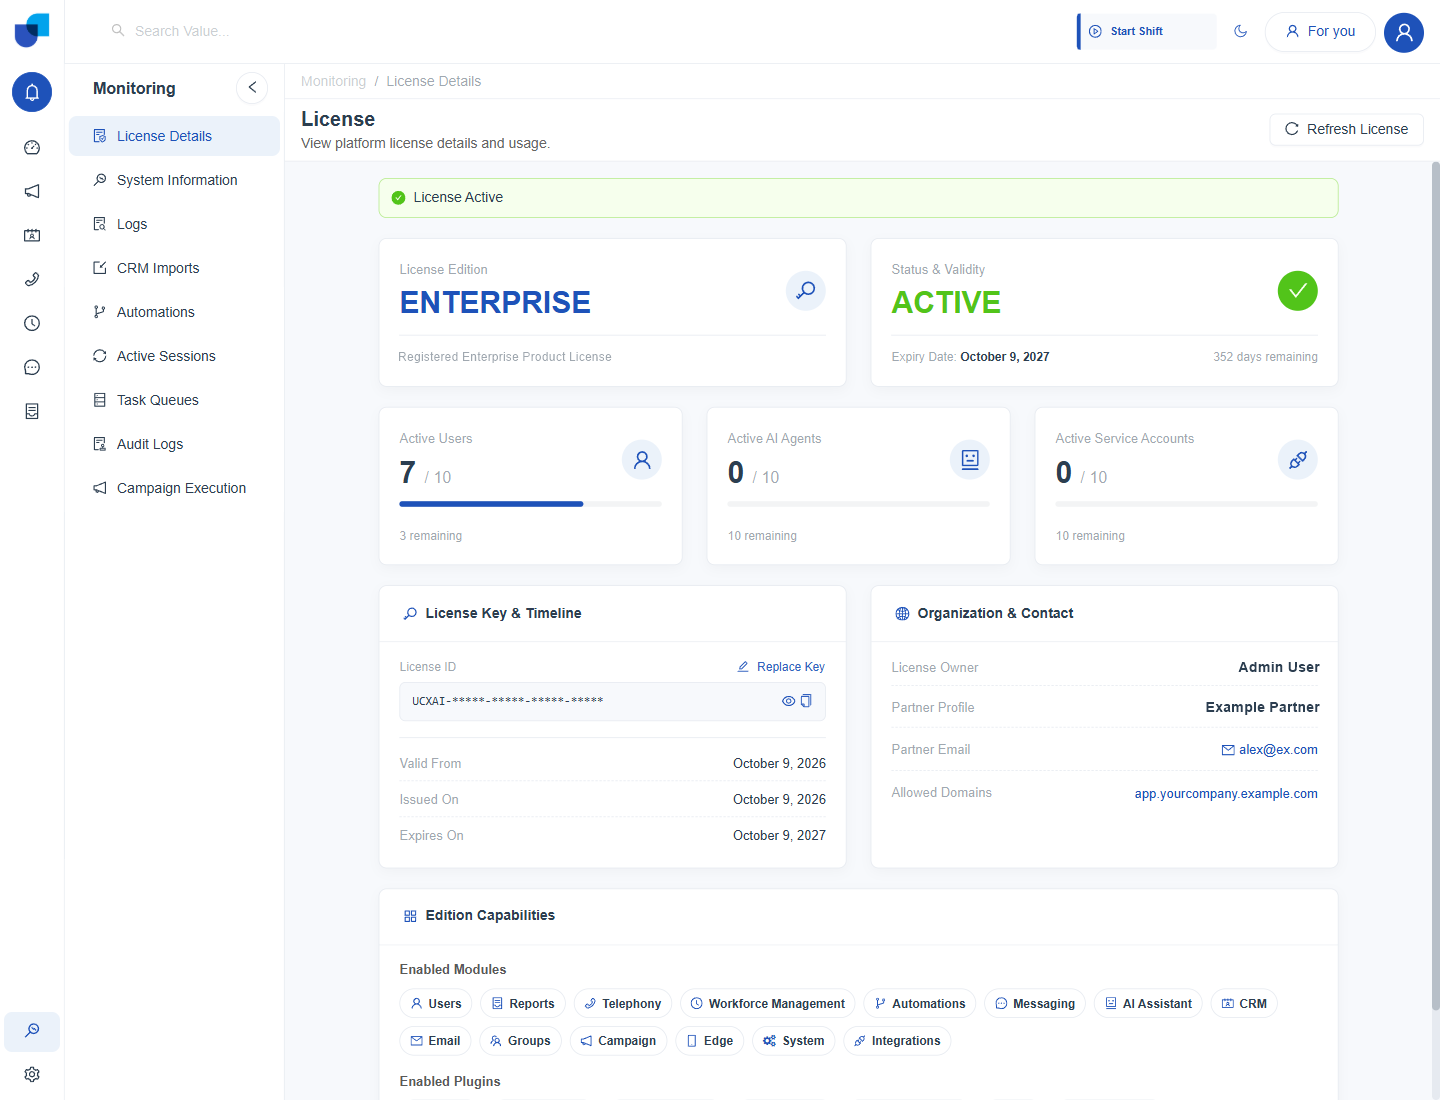
Figure 1. The License Details page, with the Monitoring side menu listing every page on the left.
info
Which Monitoring pages a person can open depends on the permissions of their role. See Monitoring Permissions.
Your First Look
| Step | Page | What to read |
|---|---|---|
| 1 | License Details | The status, the expiry date, and how many users remain. |
| 2 | System Information | System Status, CPU Usage, Memory, Services, Containers and Uptime. |
| 3 | Task Queues | The pending, done and failed counts of each queue. |
| 4 | Automations | The latest executions and their status. |
| 5 | Audit Logs | The most recent changes and who made them. |
A Daily Routine
- Open System Information and read the summary cards. System Status should read Operational. See System Health Overview.
- Open Task Queues. Look at the pending and failed counts of each queue. See Task Queues.
- Open Automations and check the latest executions. See Automation Execution Monitor.
- Open Audit Logs when a change needs explaining. See Audit Logs.
Access
Access is set on the role under Configuration → User Management → Roles, in the System Configuration group. The permissions that matter here are System Information, Manage License, Logs/Task Queues, Audit Logs, Active Session and Log Purge. CRM Imports, Automations and Campaign Execution also depend on the role's access to CRM, Automations and Campaign. See Monitoring Permissions.