Viewing and Filtering Logs
Read the platform's log files and narrow them to the entries you need.
What the Logs Page Holds
Open Monitoring → Logs. The page lets you view and manage the system logs in the current directory. A list of files and directories sits on the left, and a viewer opens on the right when you select one. Use it when you need more detail than the Audit Logs page gives.
The File List
The list contains api.log, a set of audit files, and a directory named core. Each audit file belongs to one part of the platform.
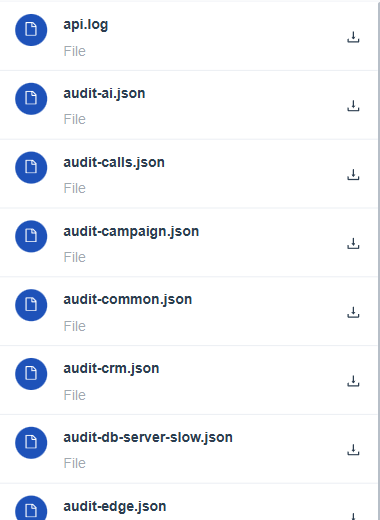
Figure 1. The file list, with a download icon at the right of every file.
| Entry | What it holds |
|---|---|
api.log | The log of requests to the platform's API. |
audit-ai.json | Audit entries for AI features. |
audit-calls.json | Audit entries for calls. |
audit-campaign.json | Audit entries for campaigns. |
audit-common.json, audit-crm.json | Audit entries for shared services and for CRM. |
audit-db-server-slow.json | Audit entries for slow database queries. |
audit-edge.json | Audit entries for Edge. See Edge Log Submission. |
audit-emailprovider.json, audit-messaging.json | Audit entries for email and messaging. |
audit-groups.json, audit-integrations.json | Audit entries for groups and integrations. |
audit-reports.json, audit-statusmanagement.json, audit-workflow.json | Audit entries for reports, status management and workflows. |
| core | A directory that holds the daily log files of the platform. |
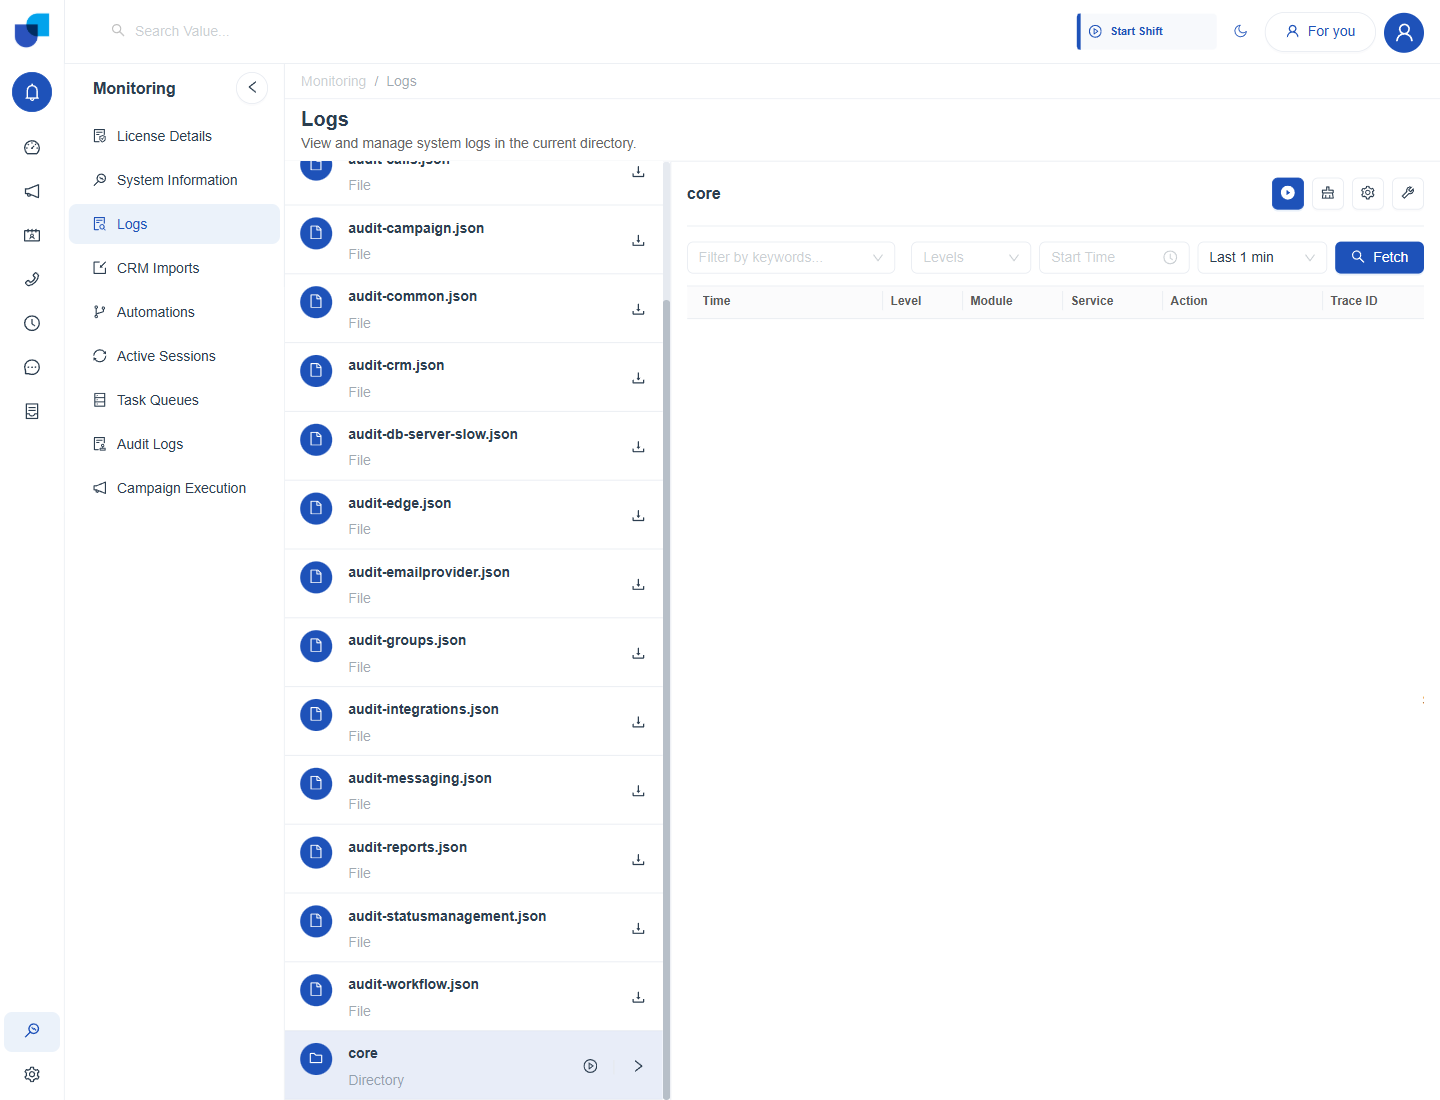
Figure 2. The Logs page with the core directory selected and its filter bar ready.
Viewing a File
- Click a file in the list. For example,
audit-edge.json. - Read the entries in the table on the right. The columns are Time, Level, Module, Service, Action, Trace ID, UID, Role and Message.
- Use Auto-Refresh (30s) to keep the view current. New entries are added as they are written.
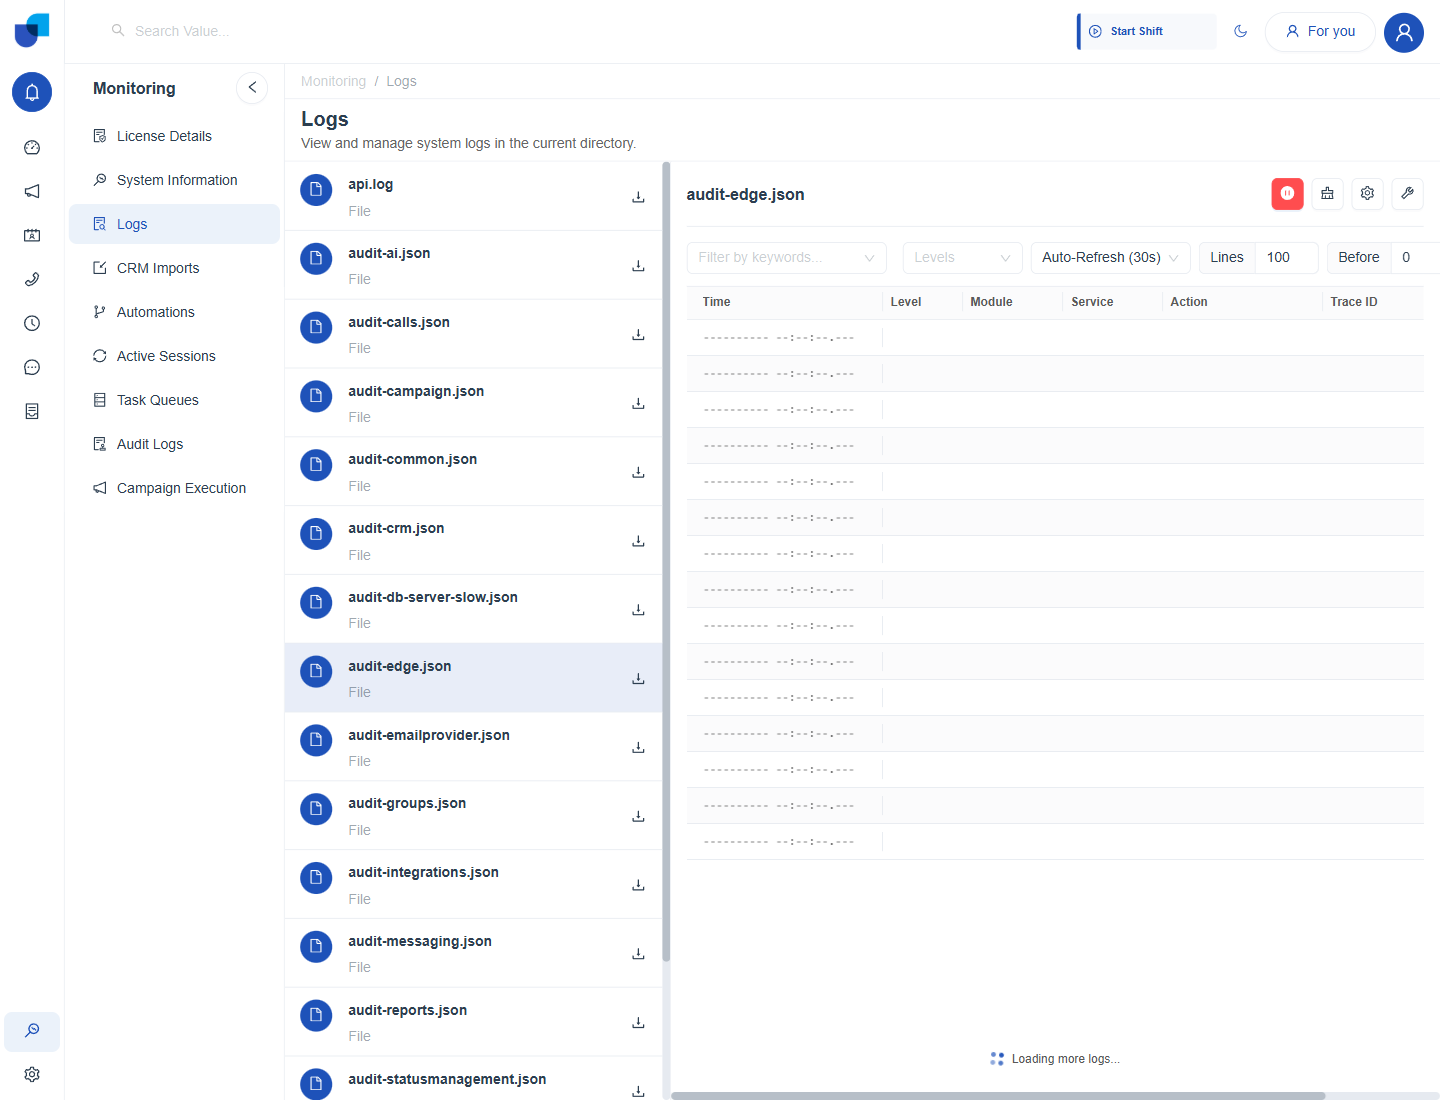
Figure 3. The viewer with audit-edge.json open, showing the filter bar and the log table.
Filtering
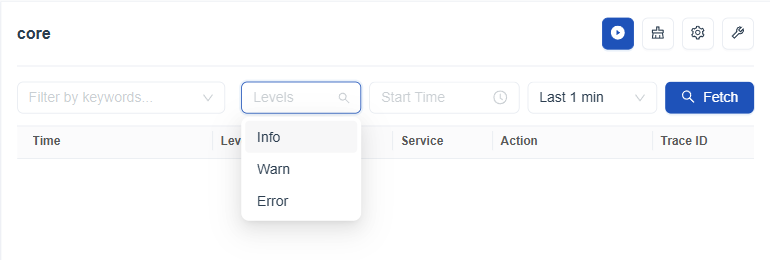
Figure 4. The Levels list, with Info, Warn and Error.
| Control | What it does |
|---|---|
| Filter by keywords | Keeps only the entries that contain your words. |
| Levels | Keeps only the entries of the levels you choose: Info, Warn or Error. |
| Auto-Refresh (30s) | Reloads the view every 30 seconds. |
| Lines | How many entries to show at a time. The default is 100. |
| Before and After | How many entries to show around a match, so you can see what happened before and after it. |
The Trace ID ties together every entry produced by one request. Copy the Trace ID from one entry and paste it into Filter by keywords to see the whole request in order.
Searching a Directory
When you select the core directory, the viewer shows Filter by keywords, Levels, a Start Time and a time window such as Last 1 min. Click Fetch to load the entries for that window. Until you click it, the page reads Select a file or directory to start streaming.
Keep the time window short when you search a directory. A narrow window returns quickly, and a wide window can return a very large number of entries.
Downloading
Each file in the list has a download icon at its right. Use it to save a file and share it with the support team.