Overview
Monitoring shows whether the platform is healthy, how much of the license is in use, and what has happened on it.
What Monitoring Is
Monitoring gathers the information an administrator needs to run UNICONNECT AI with confidence. It shows whether the platform and its services are running, how much of the license is in use, what the platform has written to its logs, which background jobs and automations have run, and who changed what. Most of it is for reading, so an administrator can check the platform without changing anything.
Monitoring is a menu with nine items. System Information opens System Health, a page that reports the state of the whole platform on one screen. This documentation is written for platform administrators.
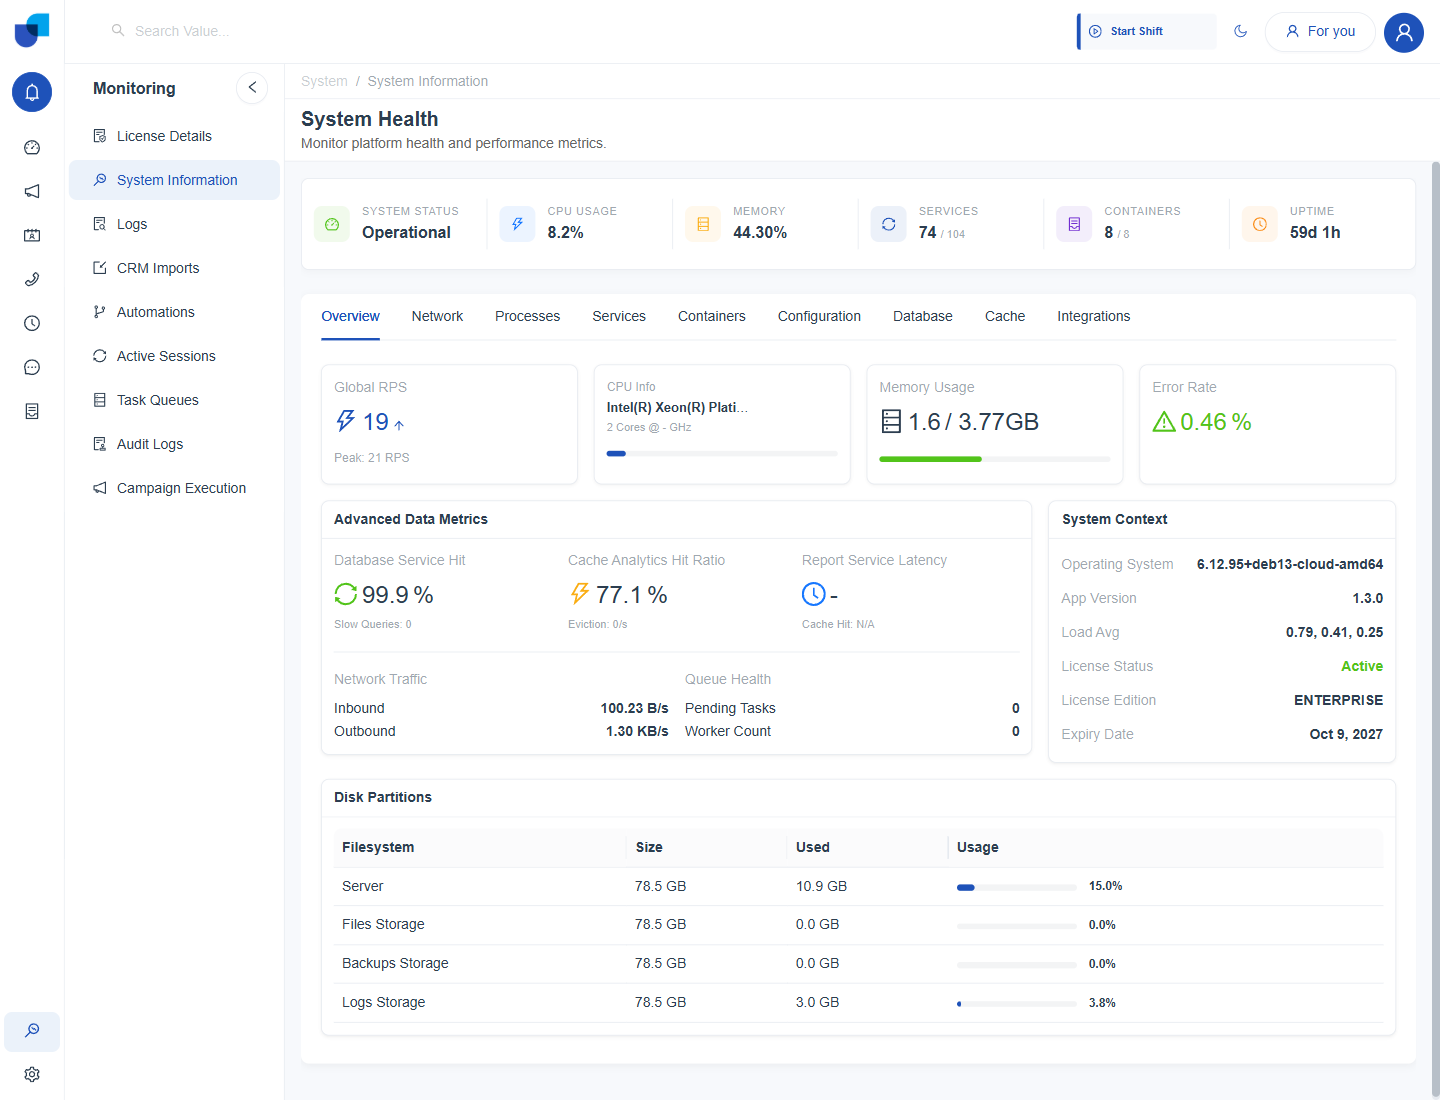
Figure 1. The System Health page, with its summary cards across the top and the Overview tab open.
Key Capabilities
- Platform health on one page. Read the summary cards and nine tabs of System Health to see the state of the server, its services and its containers.
- License and seat usage. See the edition, the expiry date, how many users and seats are in use, and which modules are enabled.
- Platform logs. Open the log files that the platform writes, follow them as they grow, and narrow them with filters.
- An audit trail. See who created, updated or deleted a record or a setting, and when.
- Background work. Follow task queues, CRM imports, automation executions and campaign runs, and look inside the ones that did not finish.
- Who is connected. See the people signed in right now, and from which device.
The Monitoring Menu
Clicking Monitoring in the main menu opens a side menu with these items. A person sees only the items that their role and the license allow.
| Menu item | What it shows |
|---|---|
| License Details | The edition, expiry date, user and seat allowances, and enabled modules. |
| System Information | System Health, with nine tabs from Overview to Integrations. |
| Logs | The log files and directories that the platform writes. |
| CRM Imports | Import jobs and their progress. |
| Automations | The Automation Execution Monitor. |
| Active Sessions | The people connected right now, and from which device. |
| Task Queues | Background task queues and their jobs. |
| Audit Logs | The trail of changes made by users. |
| Campaign Execution | Execution results for each campaign. |
Which Page Answers Which Question
| Question | Go to |
|---|---|
| Is the platform running normally? | System Information, Overview and Services tabs |
| How many users can I still add? | License Details |
| Who changed this record or setting? | Audit Logs |
| Did the campaign run, and how many contacts did it reach? | Campaign Execution |
| Did the import finish? | CRM Imports |
| Did the workflow run? | Automations, Execution History |
| Is background work waiting? | Task Queues |
| Who is signed in? | Active Sessions |
Who Does What
| Person | Typical tasks |
|---|---|
| Platform administrator | Checks health and license usage, reviews logs and queues, follows the audit trail, and decides who can open each page. |
| Campaign manager | Reads Campaign Execution to confirm that a campaign ran. |
| Operations supervisor | Checks Active Sessions and Automations when agents report that something did not happen. |
Where to Find Things
| Task | Location |
|---|---|
| Check the health of the platform | Monitoring → System Information |
| Check seats and enabled modules | Monitoring → License Details |
| Read a log file | Monitoring → Logs |
| Follow a change to a record or setting | Monitoring → Audit Logs |
| Check an import, a workflow or a campaign | Monitoring → CRM Imports, Automations or Campaign Execution |
| Decide who can open each page | Configuration → User Management → Roles |