System Health Overview
Read the platform's health and performance on one page.
What System Health Shows
Open Monitoring → System Information. The page is titled System Health and described as a place to monitor platform health and performance metrics. A row of summary cards sits above nine tabs. Open it first each morning to confirm that the platform is ready for the day.
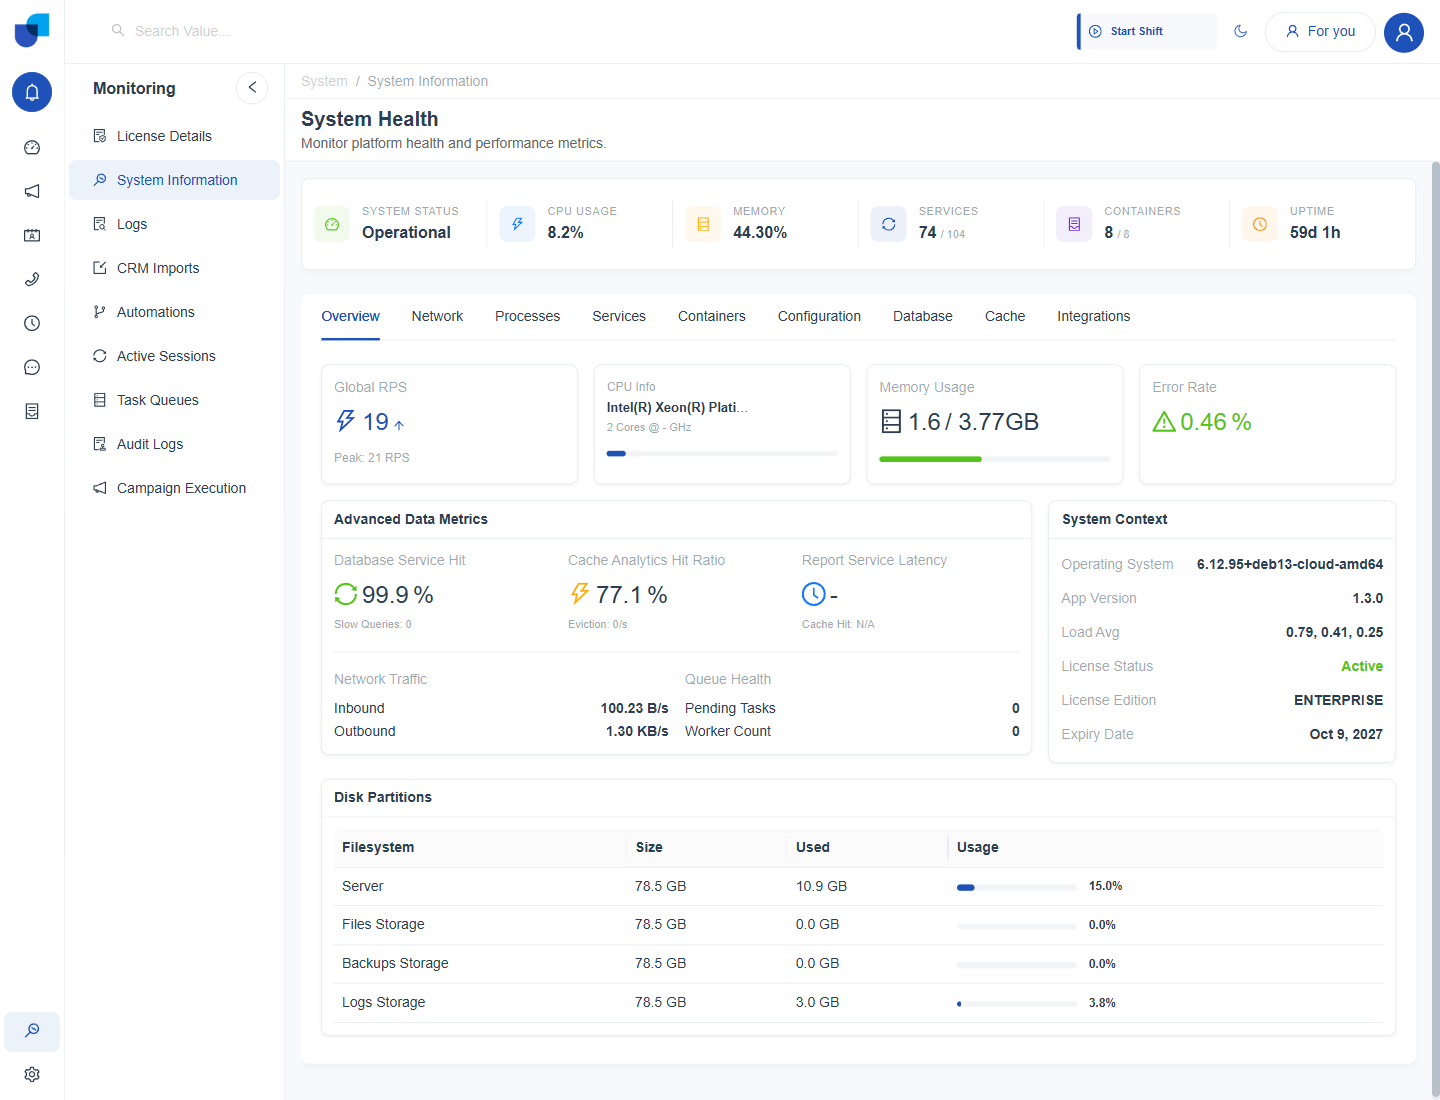
Figure 1. The System Health page on the Overview tab, with the summary cards across the top.
The Summary Cards
| Card | What it shows |
|---|---|
| System Status | The overall state of the platform. Operational means it is running normally. |
| CPU Usage | The share of processor capacity in use right now. |
| Memory | The share of memory in use. |
| Services | Services running out of all services, for example 74 of 104. |
| Containers | Containers running out of all containers, for example 8 of 8. |
| Uptime | How long the platform has been running, for example 59 days and 1 hour. |
The cards stay at the top while you move between tabs, so the overall picture is always in view. The numbers refresh as the platform reports new values.
The Overview Tab
| Block | What it shows |
|---|---|
| Global RPS | Requests per second now, with the peak. |
| CPU Info | The processor model and its number of cores. |
| Memory Usage | Memory used against total memory, with a bar. |
| Error Rate | The share of requests that returned errors. |
| Database Service Hit | The database hit rate, with the count of slow queries. |
| Cache Analytics Hit Ratio | How often the cache answers a request, with evictions per second. |
| Report Service Latency | How long the report service takes to answer, with its cache hit state. |
| Network Traffic | Inbound and outbound traffic per second. |
| Queue Health | Pending tasks and the worker count. |
| System Context | The operating system, the app version, the load average, and the license status, edition and expiry date. |
Disk Partitions
The Disk Partitions table lists Server, Files Storage, Backups Storage and Logs Storage. Each row shows the size, the amount used, and a usage bar with a percentage. Watch Logs Storage and Files Storage over time, because they grow as the platform is used.
The values in System Context describe the server that the platform runs on, so they change only when the server changes. Disk Partitions grow as the platform is used. Use them to confirm the version and the capacity, and note the storage figures from time to time.
The Other Tabs
Network, Processes, Services, Containers, Configuration, Database, Cache and Integrations each go deeper into one part of the platform. They are described in Health Tabs.