Health Tabs
What each tab of System Health shows, after the Overview tab.
Network
The Network tab describes how the platform is reached. Host Identity shows the FQDN and the IP address. SSL / Security shows whether SSL is enabled, whether the certificate is valid, and the expiry date with the days left. Required Port Audit counts the required ports that are open, and lists each by protocol, service, local address and status. A table at the end lists each certificate by domain, issuer, validity period, status and days left.
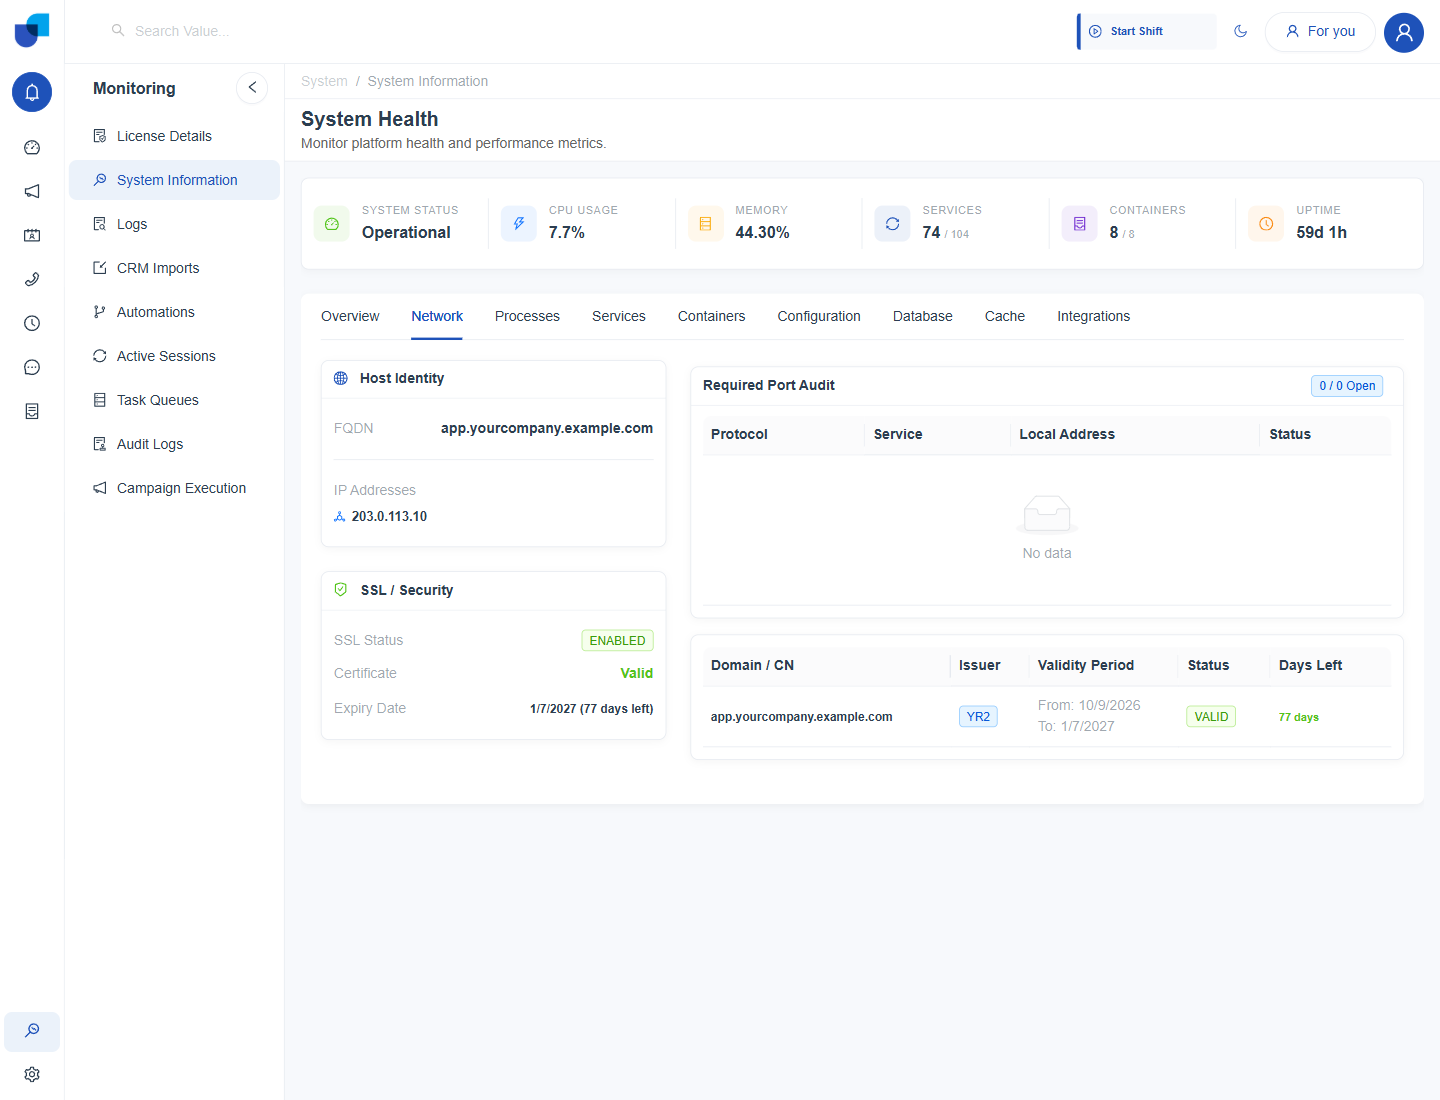
Figure 1. The Network tab, with the host identity, the SSL status and the certificate table.
The Days Left column counts down to the certificate expiry date. Renew the certificate before it reaches zero, because users cannot connect securely once it expires.
Processes
Top System Processes Telemetry lists the busiest processes. Two sub tabs sort the list: Sorted by CPU Time and Sorted by Resident Memory. Each row shows the PID, name, state, CPU time, resident memory (RSS), virtual memory and the user ID.
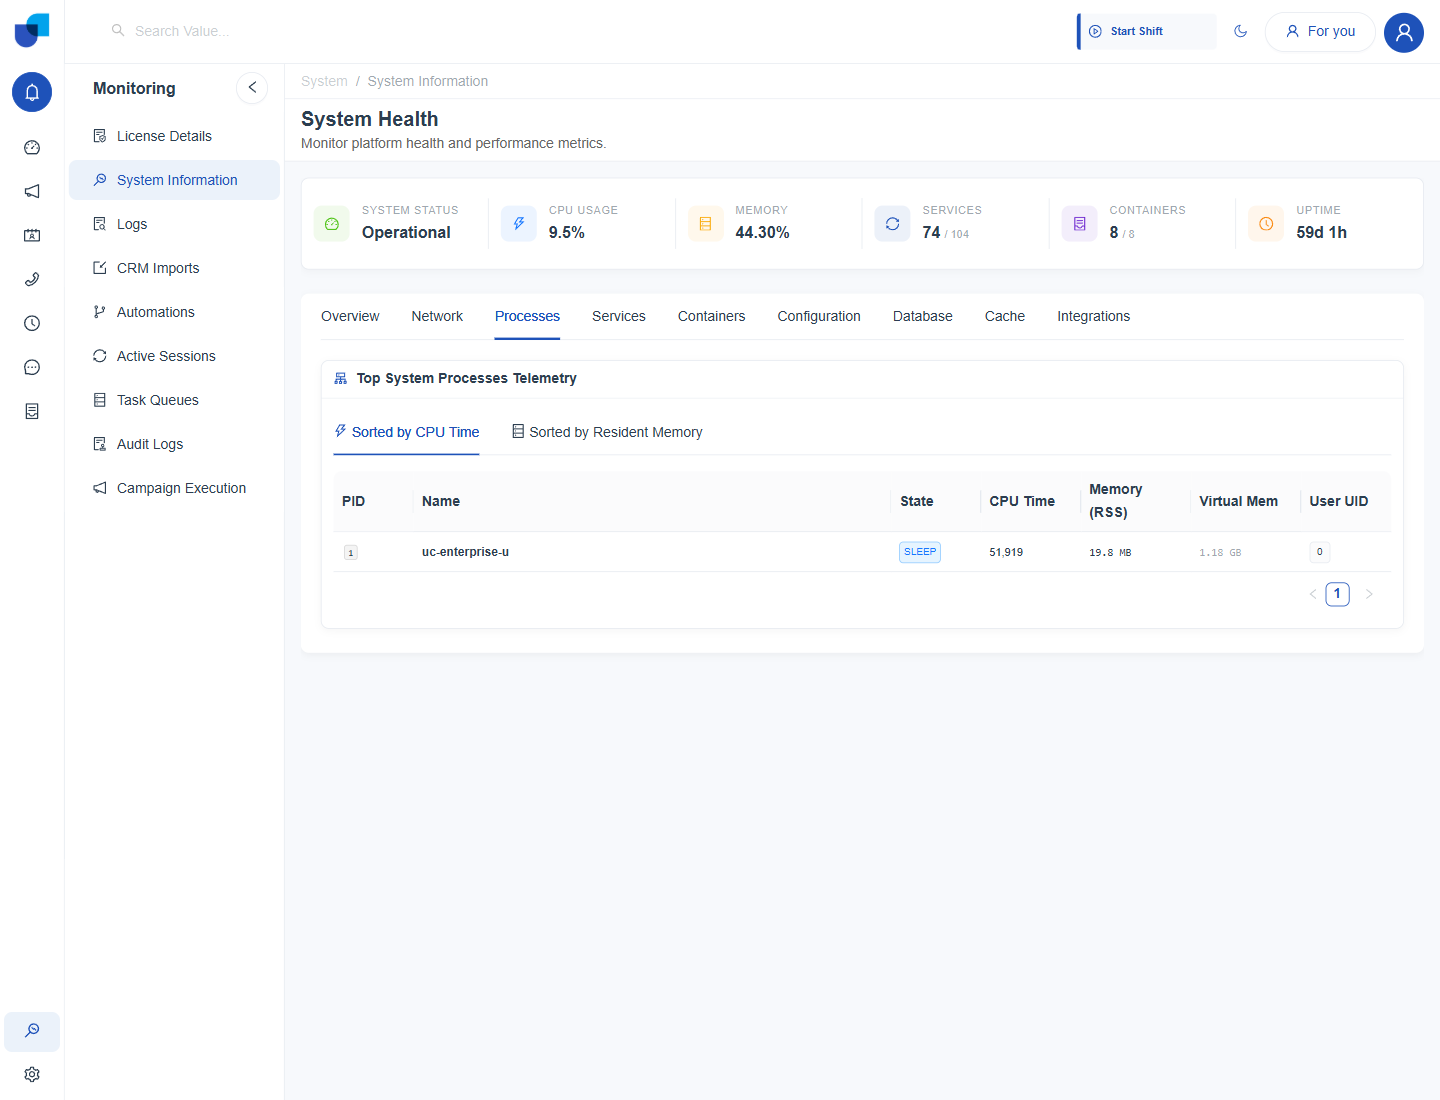
Figure 2. The Processes tab, sorted by CPU time.
Services
The Services tab lists each group of services: Common, Status Management, Telephony, Messaging, Email, CRM, Campaign, Groups, Reports, Workflows, Integrations, AI and Edge. For each group it shows the Status, a Summary of dots with a count such as 5 of 5, the Latency, the Uptime and row actions. Click the plus sign beside a name to see the individual services in the group.
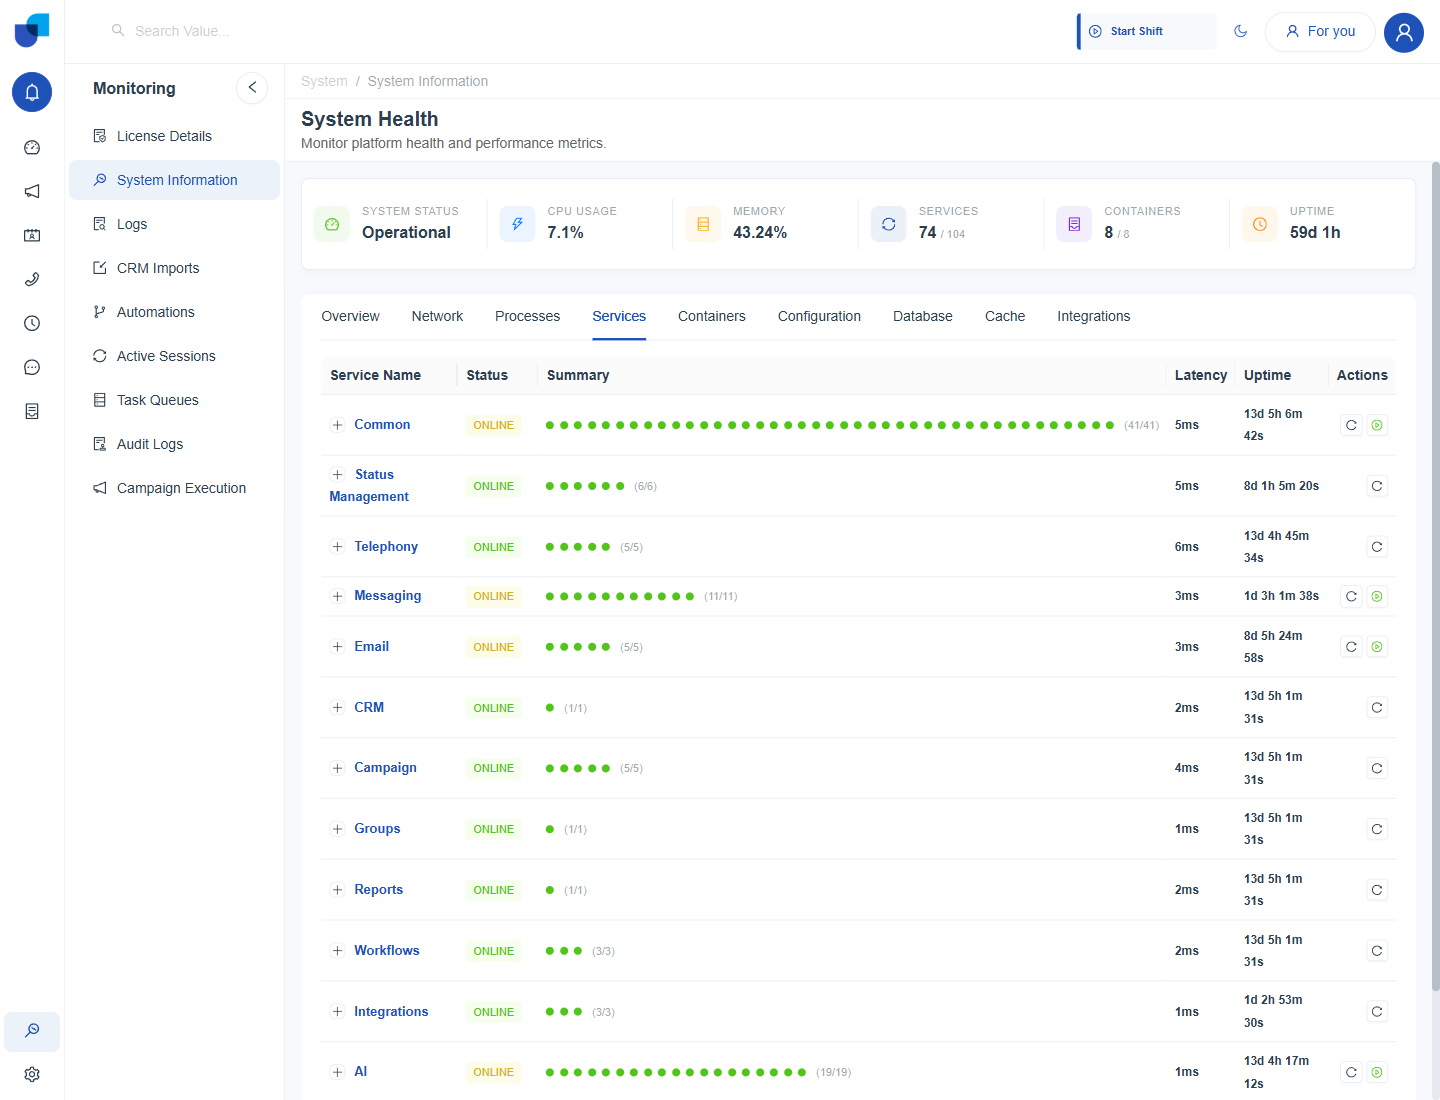
Figure 3. The Services tab, with one row for each group of services and a dot for every service in it.
| Status | Meaning |
|---|---|
| ONLINE | Every service in the group is running. |
| DEGRADED | Only some of the services in the group are running. The count in the Summary column shows how many. |
The Services card at the top of the page counts every individual service across all groups, so its total is larger than the number of rows on this tab.
Containers
Each container has a card with its name, its RUNNING state and its container ID. The card shows CPU Usage, Memory Footprint, Uptime and Restarts. The cards in this example include UC Frontend Service, UC Backend Service, UC Report Analytics Service, UC Report Service, UC System Manager Service, UC Database Service and UC Cache Analytics. The Containers card at the top of the page counts them, so its total can change when a container is added or stopped.
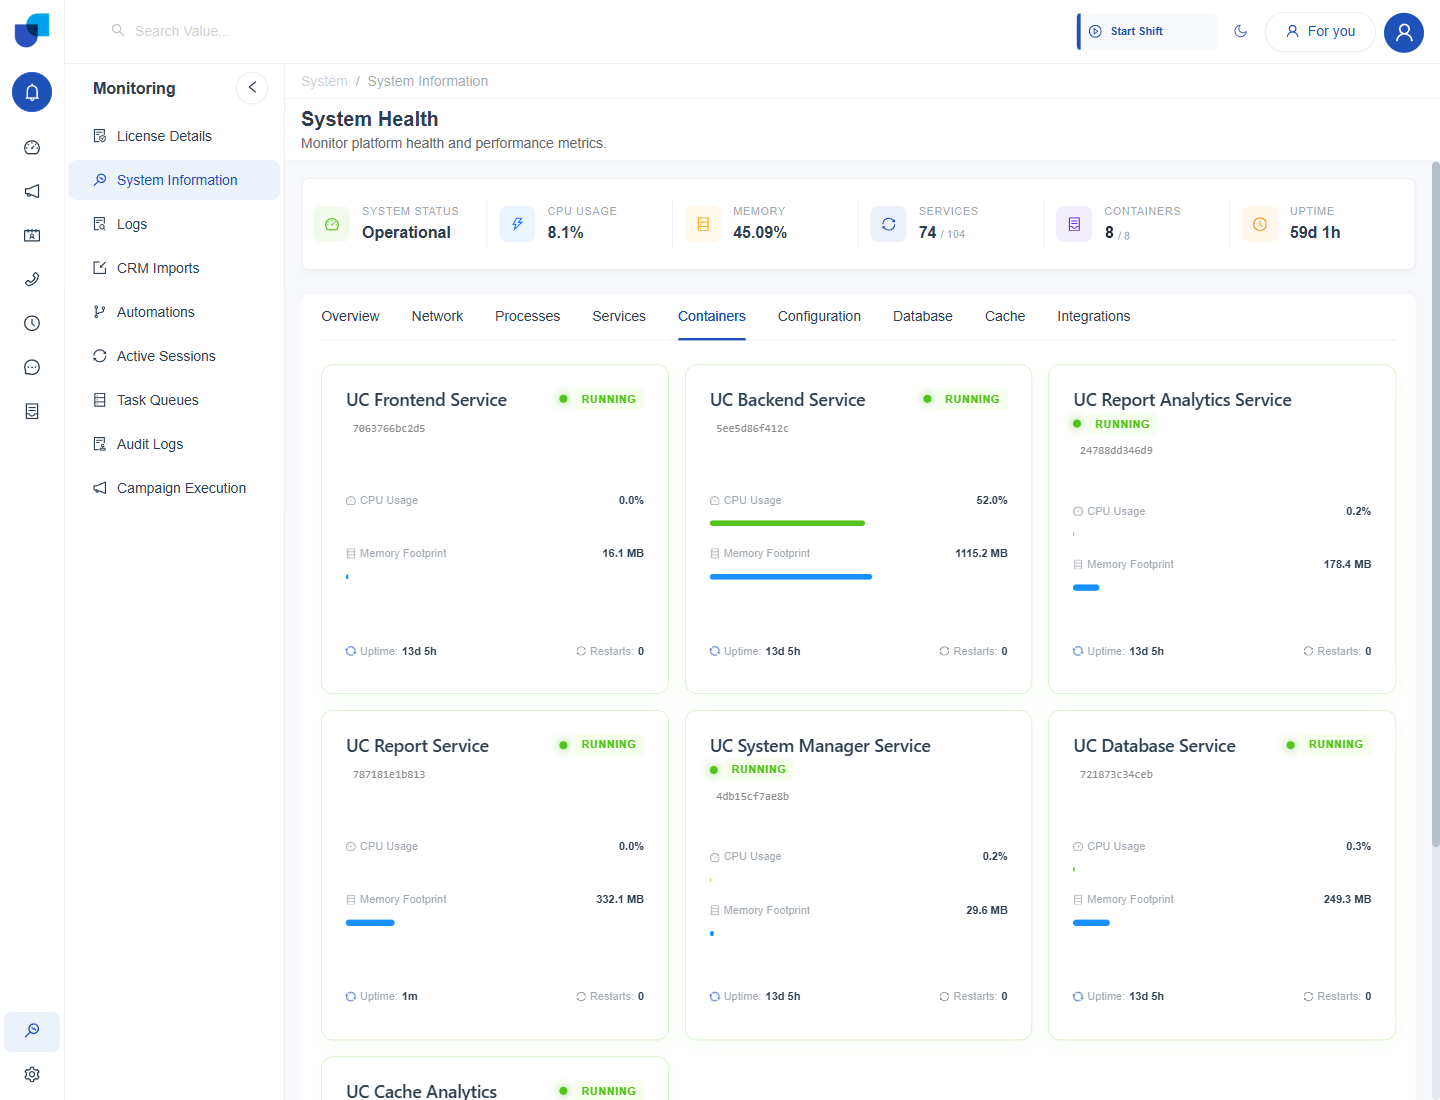
Figure 4. The Containers tab, with a card for each container. The list continues below the cards shown here.
Configuration
The Configuration tab lists the settings of the platform's building blocks in four panels.
| Panel | What it shows |
|---|---|
| Database Configuration | The version, the maximum connections, the shared buffers and the connection status. |
| Cache Analytics Configuration | The version, the maximum memory, the persistence mode and the deployment mode. |
| Report Service Framework | The version, the schema cache, the deployment and the query orchestrator status. |
| Meta Infrastructure | The log level, the time zone, the environment and the node name. |
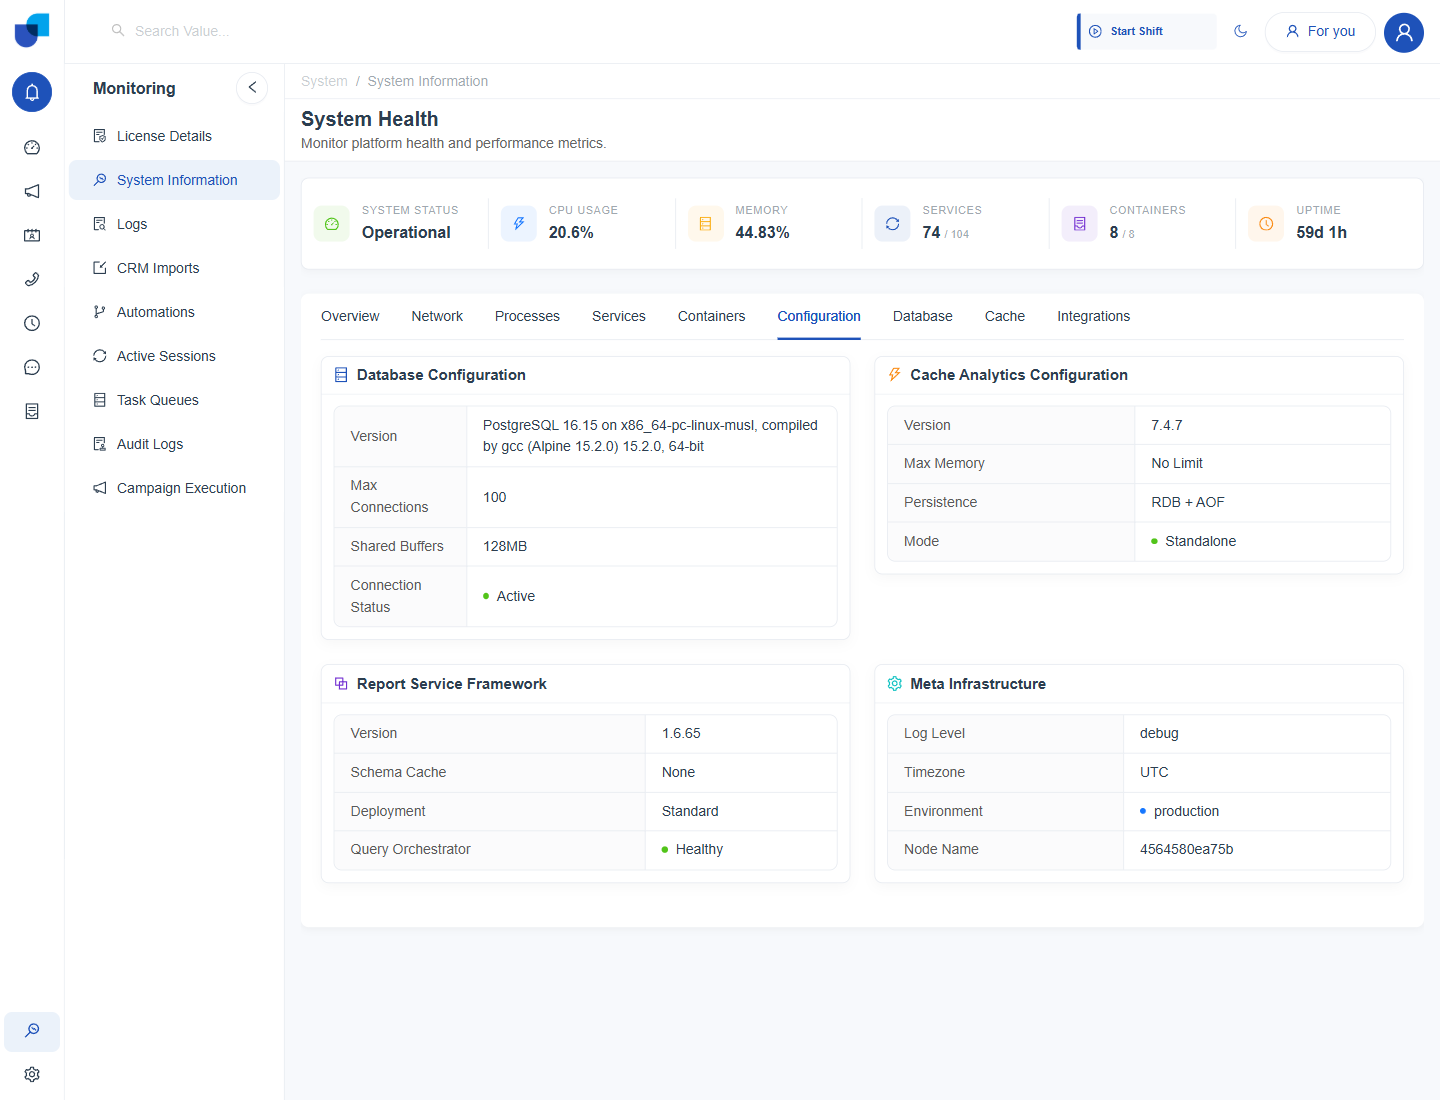
Figure 5. The Configuration tab, with the four panels of platform settings.
Database
Database Health helps you watch connection pool use, query hit rates, table bloat and locks, and run optimization scripts. Three counters sit above it: Critical Bottlenecks, Optimization Warnings and Info and Diagnostics. Refresh Diagnostics runs the checks again.
Eight sub tabs organize the detail: Issues and Recommendations, Server Configuration, Connections and Sessions, Tables and Sizes, Buffer Cache Hit Ratio, Index Health and Bloat, Locks and Wraparound, and Optimization Console. Issues and Recommendations lists each finding with its Severity, Category, Issue and Recommendation.
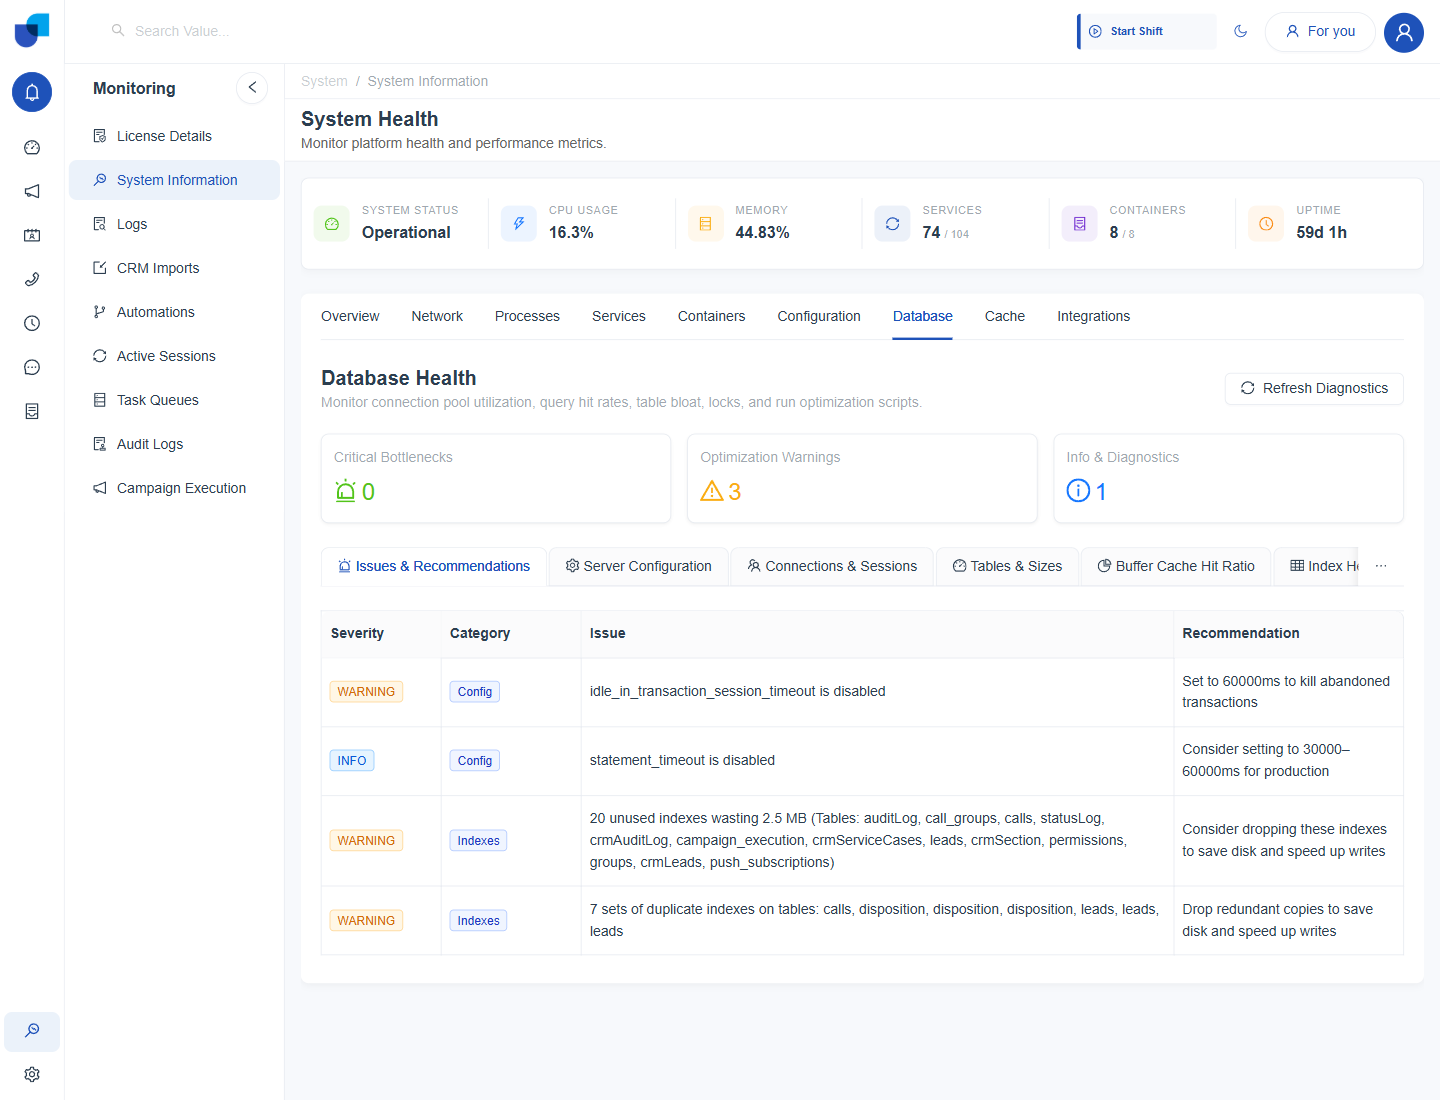
Figure 6. The Database tab, with the three counters and the Issues and Recommendations table.
Severity is shown as CRITICAL, WARNING or INFO. A recommendation is advice about tuning, and nothing changes until an administrator acts on it.
Cache
The Cache tab shows the Status and whether it is connected, the Memory Usage with its peak, the Fragmentation and the Latency of the last response. Client Connections lists the connected and blocked clients and the Max Clients Limit. Performance Indicators show Ops Per Second, Evicted Keys and the Cache Hit Rate.
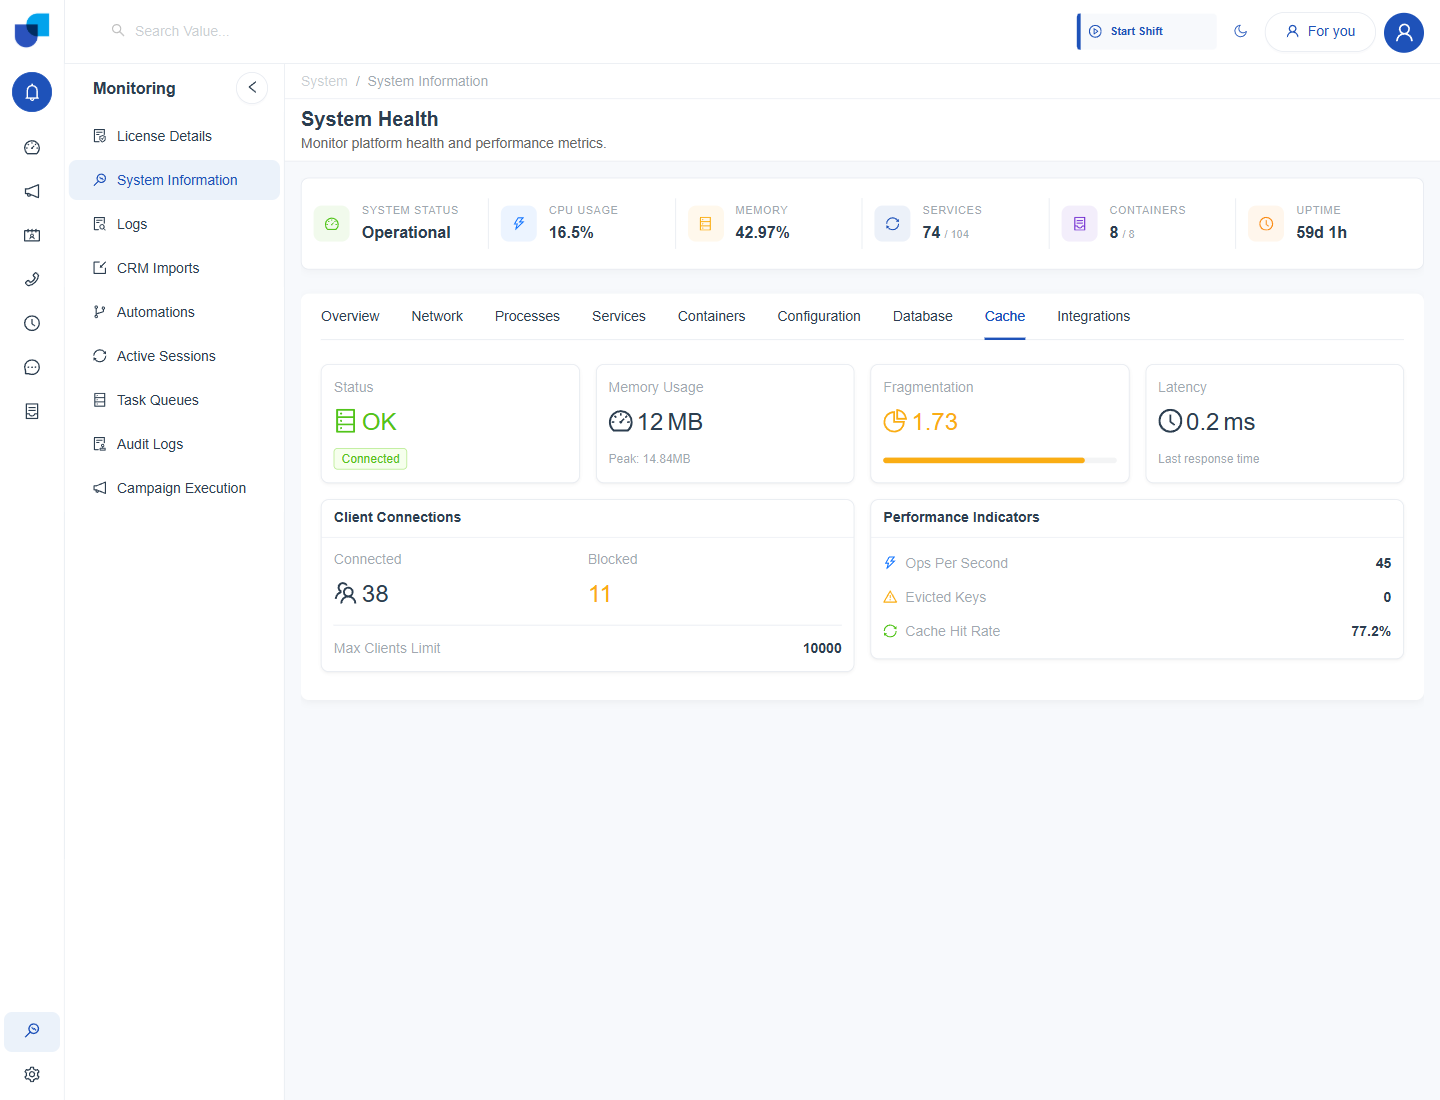
Figure 7. The Cache tab, with memory, connection and hit rate figures.
Integrations
The Integrations tab shows a card for each integration plugin that is switched on, with its name, an Active label, a short description and its plugin code. In this example Mailgun Email and 3CX are active.
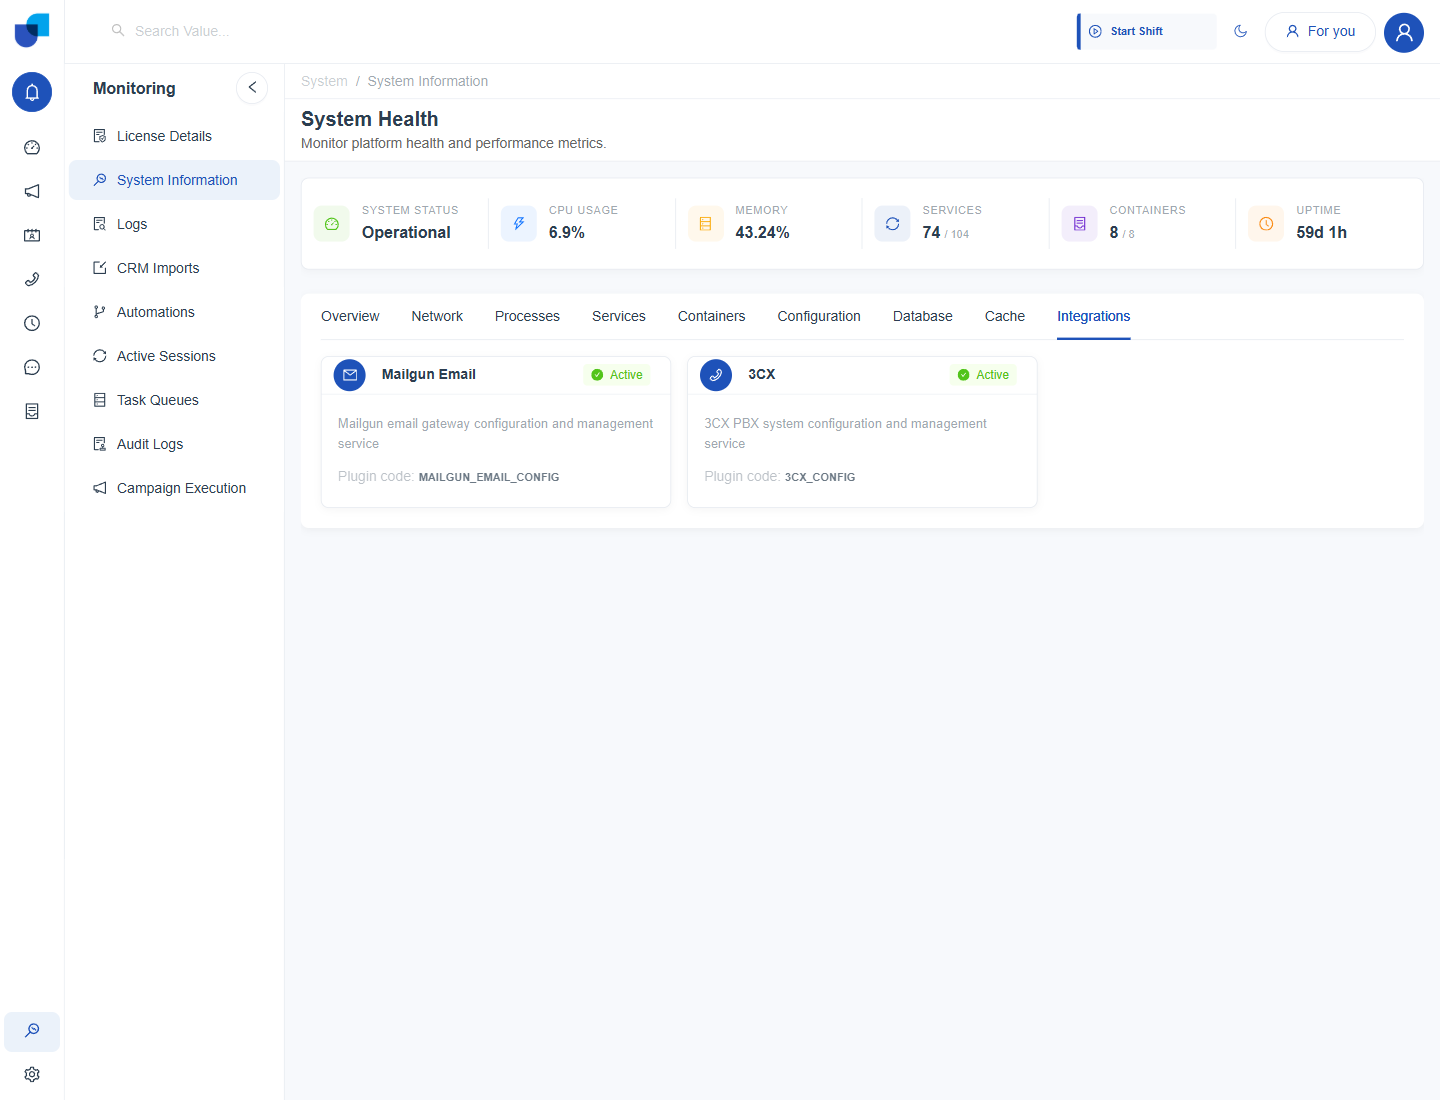
Figure 8. The Integrations tab, with a card for each active integration plugin.
This tab lists integration plugins, such as email and telephone connections. It is not the same as Configuration → Integrations, where service accounts, webhooks and API collections are managed.